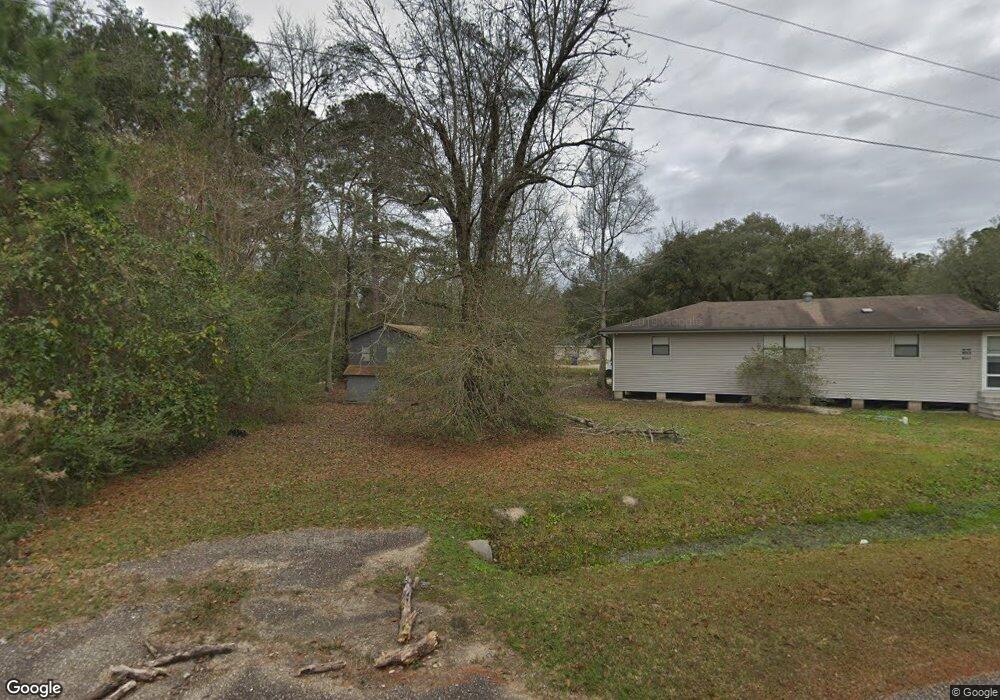
209 Tulip St Slidell, LA 70460
Estimated Value: $88,000 - $135,000
3
Beds
1
Bath
966
Sq Ft
$109/Sq Ft
Est. Value
About This Home
This home is located at 209 Tulip St, Slidell, LA 70460 and is currently estimated at $105,308, approximately $109 per square foot. 209 Tulip St is a home located in St. Tammany Parish with nearby schools including Cypress Cove Elementary School, Honey Island Elementary School, and Little Oak Middle School.
Ownership History
Date
Name
Owned For
Owner Type
Purchase Details
Closed on
Feb 7, 2012
Sold by
Co Jpmorgan Chase Bank Na
Bought by
Federal National Mortgage Association
Current Estimated Value
Purchase Details
Closed on
Oct 21, 2008
Sold by
Federal National Mortgage Association
Bought by
Adams Raymond K
Purchase Details
Closed on
Feb 18, 2005
Sold by
Carter Blackwell Marsha Ann
Bought by
Comichael V R&M Delaney Llc and Id Delaney
Create a Home Valuation Report for This Property
The Home Valuation Report is an in-depth analysis detailing your home's value as well as a comparison with similar homes in the area
Home Values in the Area
Average Home Value in this Area
Purchase History
| Date | Buyer | Sale Price | Title Company |
|---|---|---|---|
| Federal National Mortgage Association | $76,458 | None Available | |
| Adams Raymond K | $28,000 | None Available | |
| Comichael V R&M Delaney Llc | $41,500 | Aj Title Company Inc |
Source: Public Records
Tax History Compared to Growth
Tax History
| Year | Tax Paid | Tax Assessment Tax Assessment Total Assessment is a certain percentage of the fair market value that is determined by local assessors to be the total taxable value of land and additions on the property. | Land | Improvement |
|---|---|---|---|---|
| 2024 | $561 | $4,153 | $700 | $3,453 |
| 2023 | $582 | $3,526 | $700 | $2,826 |
| 2022 | $53,898 | $3,526 | $700 | $2,826 |
| 2021 | $538 | $3,526 | $700 | $2,826 |
| 2020 | $536 | $3,526 | $700 | $2,826 |
| 2019 | $570 | $3,632 | $679 | $2,953 |
| 2018 | $572 | $3,632 | $679 | $2,953 |
| 2017 | $576 | $3,632 | $679 | $2,953 |
| 2016 | $588 | $3,632 | $679 | $2,953 |
| 2015 | $580 | $3,476 | $650 | $2,826 |
| 2014 | $569 | $3,476 | $650 | $2,826 |
| 2013 | -- | $3,476 | $650 | $2,826 |
Source: Public Records
Map
Nearby Homes