Estimated Value: $309,183 - $316,000
5
Beds
3
Baths
2,566
Sq Ft
$122/Sq Ft
Est. Value
About This Home
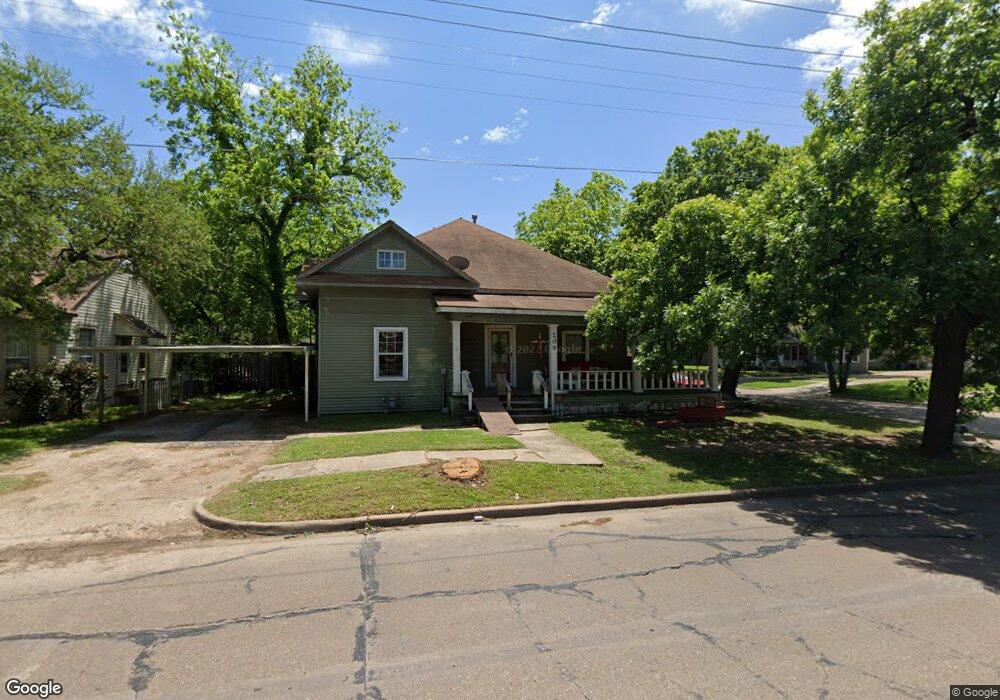
This home is located at 209 W Gilmer St, Ennis, TX 75119 and is currently estimated at $312,592, approximately $121 per square foot. 209 W Gilmer St is a home located in Ellis County with nearby schools including Jack Lummus Intermediate School, Bowie Elementary School, and Ennis Junior High School.
Ownership History
Date
Name
Owned For
Owner Type
Purchase Details
Closed on
Mar 26, 2019
Sold by
Crawford Dirk M and Crawford Linda B
Bought by
Montemayor George J and Montemayor Christina R
Current Estimated Value
Home Financials for this Owner
Home Financials are based on the most recent Mortgage that was taken out on this home.
Original Mortgage
$79,000
Outstanding Balance
$50,871
Interest Rate
4.3%
Mortgage Type
Seller Take Back
Estimated Equity
$261,721
Purchase Details
Closed on
Mar 7, 2016
Sold by
C C Crawford Tire Inc
Bought by
Crawford Dirk M and Crawford Linda B
Purchase Details
Closed on
Sep 28, 2012
Sold by
Knox Sales Co and Crawford Mary Frances
Bought by
C C Crawford Tire Co Inc
Purchase Details
Closed on
Nov 11, 2008
Sold by
Lasalle Bank N A
Bought by
Knox Sales Co
Purchase Details
Closed on
Feb 5, 2008
Sold by
Venus Terry L and Venus Cindi F
Bought by
Lasalle Bank Na
Create a Home Valuation Report for This Property
The Home Valuation Report is an in-depth analysis detailing your home's value as well as a comparison with similar homes in the area
Home Values in the Area
Average Home Value in this Area
Purchase History
| Date | Buyer | Sale Price | Title Company |
|---|---|---|---|
| Montemayor George J | -- | None Available | |
| Crawford Dirk M | -- | None Available | |
| C C Crawford Tire Co Inc | -- | None Available | |
| Knox Sales Co | -- | -- | |
| Lasalle Bank Na | $128,010 | -- |
Source: Public Records
Mortgage History
| Date | Status | Borrower | Loan Amount |
|---|---|---|---|
| Open | Montemayor George J | $79,000 |
Source: Public Records
Tax History Compared to Growth
Tax History
| Year | Tax Paid | Tax Assessment Tax Assessment Total Assessment is a certain percentage of the fair market value that is determined by local assessors to be the total taxable value of land and additions on the property. | Land | Improvement |
|---|---|---|---|---|
| 2025 | $2,766 | $198,404 | $65,000 | $133,404 |
| 2024 | $2,766 | $187,086 | -- | -- |
| 2023 | $2,766 | $170,078 | $0 | $0 |
| 2022 | $4,007 | $167,440 | $33,000 | $134,440 |
| 2021 | $3,539 | $140,560 | $26,250 | $114,310 |
| 2020 | $3,729 | $144,920 | $22,500 | $122,420 |
| 2019 | $2,321 | $88,570 | $0 | $0 |
| 2018 | $1,931 | $73,670 | $12,500 | $61,170 |
| 2017 | $1,979 | $74,590 | $12,000 | $62,590 |
| 2016 | $1,961 | $73,910 | $12,000 | $61,910 |
| 2015 | $1,907 | $58,500 | $12,000 | $46,500 |
| 2014 | $1,907 | $72,000 | $0 | $0 |
Source: Public Records
Map
Nearby Homes
- 801 N Mckinney St
- 802 N Sherman St
- 1106 N Mckinney St
- 800 N Sherman St
- 607 N Dallas St
- 606 N Dallas St
- 603 N Mckinney St
- 811 N Gaines St
- 408 W Decatur St
- 3712 Kings Dr
- 1206 N Kaufman St
- 0000 Belknap St
- 206 E Belknap St
- 410 E Denton St
- 206 Houston St
- 1006 E Denton St
- 301 E Denton St
- 1311 Daffan Ave
- 0 E Denton St Unit 20761063
- 700 Loggins St
- 207 W Gilmer St
- 205 W Gilmer St
- 212 W Latimer St
- 208 W Latimer St
- 909 N Mckinney St
- 907 N Mckinney St
- 206 W Latimer St
- 210 W Gilmer St
- 206 W Gilmer St
- 204 W Latimer St
- 1001 N Mckinney St
- 909 N Dallas St
- 903 N Mckinney St
- 204 W Gilmer St
- 202 W Gilmer St
- 901 N Mckinney St
- 202 W Latimer St
- 1006 N Mckinney St
- 200 W Gilmer St
- 908 N Sherman St