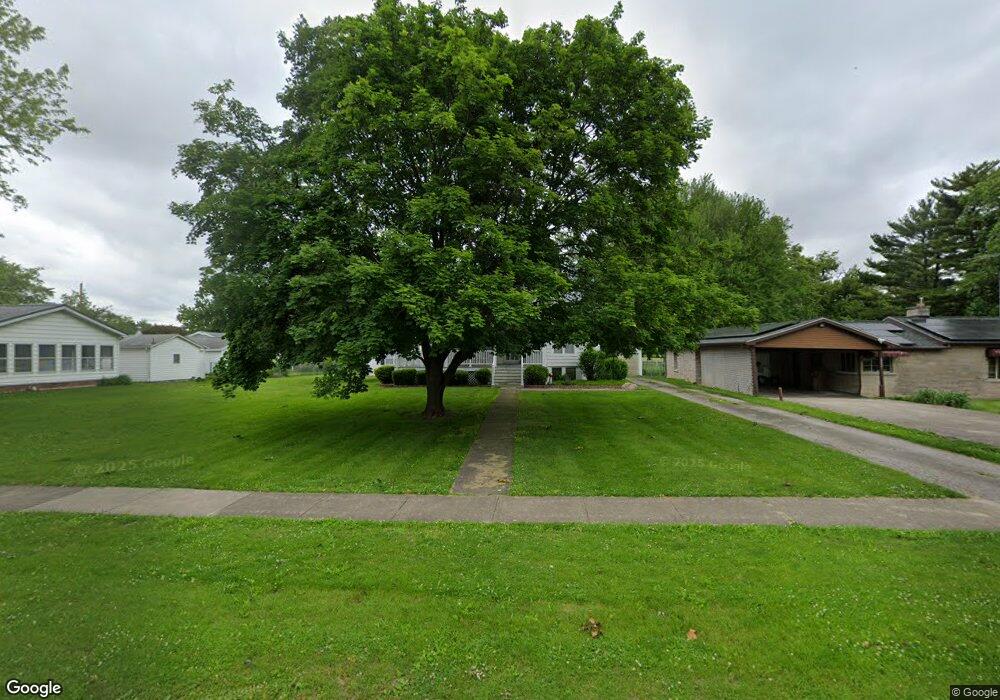
209 W Main St Oakland, IL 61943
Estimated Value: $103,657 - $208,000
3
Beds
3
Baths
1,419
Sq Ft
$100/Sq Ft
Est. Value
About This Home
This home is located at 209 W Main St, Oakland, IL 61943 and is currently estimated at $142,414, approximately $100 per square foot. 209 W Main St is a home located in Coles County with nearby schools including Lake Crest Elementary School and Oakland High School.
Ownership History
Date
Name
Owned For
Owner Type
Purchase Details
Closed on
Dec 21, 2009
Sold by
Shanks Lori Anne
Bought by
Clapp Nicholas R
Current Estimated Value
Home Financials for this Owner
Home Financials are based on the most recent Mortgage that was taken out on this home.
Original Mortgage
$81,600
Outstanding Balance
$53,224
Interest Rate
4.9%
Mortgage Type
New Conventional
Estimated Equity
$89,190
Purchase Details
Closed on
Jun 7, 2007
Sold by
Hackett Terry L and Burkybile Karen L
Bought by
Shanks Leo Verlon and Shanks Lori Anne
Home Financials for this Owner
Home Financials are based on the most recent Mortgage that was taken out on this home.
Original Mortgage
$61,406
Interest Rate
6.2%
Mortgage Type
New Conventional
Purchase Details
Closed on
Jan 23, 2007
Sold by
Hackett Jackie A
Bought by
Hackett Terry L and Burkybile Karen L
Home Financials for this Owner
Home Financials are based on the most recent Mortgage that was taken out on this home.
Original Mortgage
$59,500
Interest Rate
6.22%
Mortgage Type
Future Advance Clause Open End Mortgage
Create a Home Valuation Report for This Property
The Home Valuation Report is an in-depth analysis detailing your home's value as well as a comparison with similar homes in the area
Home Values in the Area
Average Home Value in this Area
Purchase History
| Date | Buyer | Sale Price | Title Company |
|---|---|---|---|
| Clapp Nicholas R | $80,000 | None Available | |
| Shanks Leo Verlon | $60,000 | None Available | |
| Hackett Terry L | $60,000 | None Available |
Source: Public Records
Mortgage History
| Date | Status | Borrower | Loan Amount |
|---|---|---|---|
| Open | Clapp Nicholas R | $81,600 | |
| Previous Owner | Shanks Leo Verlon | $61,406 | |
| Previous Owner | Hackett Terry L | $59,500 |
Source: Public Records
Tax History Compared to Growth
Tax History
| Year | Tax Paid | Tax Assessment Tax Assessment Total Assessment is a certain percentage of the fair market value that is determined by local assessors to be the total taxable value of land and additions on the property. | Land | Improvement |
|---|---|---|---|---|
| 2024 | $2,360 | $33,324 | $4,925 | $28,399 |
| 2023 | $2,354 | $33,324 | $4,925 | $28,399 |
| 2022 | $2,178 | $29,508 | $5,450 | $24,058 |
| 2021 | $2,100 | $26,667 | $4,925 | $21,742 |
| 2020 | $2,122 | $27,630 | $5,103 | $22,527 |
| 2019 | $2,430 | $29,851 | $4,037 | $25,814 |
| 2018 | $2,428 | $29,851 | $4,037 | $25,814 |
| 2017 | $2,506 | $29,851 | $4,037 | $25,814 |
| 2016 | $2,564 | $29,851 | $4,037 | $25,814 |
| 2015 | $2,489 | $29,851 | $4,037 | $25,814 |
| 2014 | $2,489 | $29,851 | $4,037 | $25,814 |
| 2013 | $2,489 | $29,851 | $4,037 | $25,814 |
Source: Public Records
Map
Nearby Homes
- 100 N Reel St
- 512 Norton Dr
- 312 Ashmore Rd
- 215 Silver St
- 509 Lakeshore Dr
- 22518 State Highway 133
- 0 E Co Road 1550 N
- Moody Rd Unit Lot WP001
- County Road 1550 N
- 0 County Road 2300 Rd E Unit 24630606
- 0 County Road 2300 Rd E Unit RMAPA1260552
- 212 Michigan St
- 18428 E Co Road 1500 N
- 206 S Boyer Ave
- 20315 Airtight Rd
- 12 E Walnut St
- 6 S Oakland Rd
- 2445 E County Road 875 N
- 210 Buena Vista St
- 137 E Buena Vista St
- 207 W Main St
- 12 N Jonathan St
- 211 W Main St
- 102 N Jonathan St
- 205 W Main St
- 210 W Main St
- 301 W Main St
- 218 W Main St
- 101 N Jonathan St
- 5 N Parker St
- 208 W Main St
- 100 N Jonathan St
- 201 W Main St
- 204 W Main St
- 101 N Parker St
- 202 W Main St
- 105 N Parker St
- 107 N Parker St
- 302 W Main St
- 103 N Jonathan St