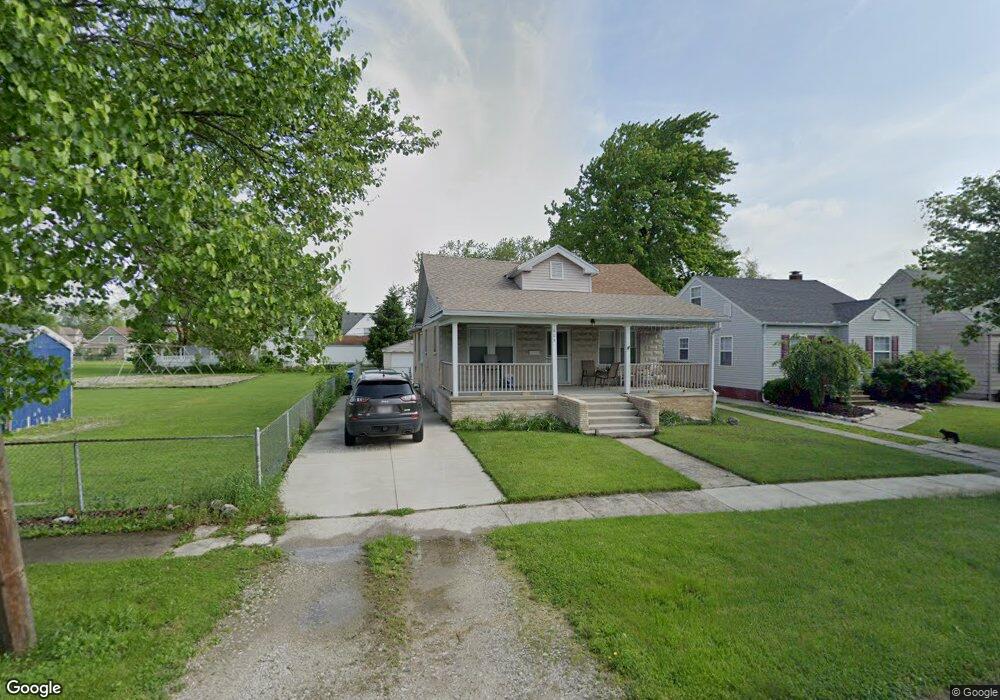
209 Wilber St Walbridge, OH 43465
Estimated Value: $139,000 - $160,000
3
Beds
1
Bath
1,120
Sq Ft
$136/Sq Ft
Est. Value
About This Home
This home is located at 209 Wilber St, Walbridge, OH 43465 and is currently estimated at $152,118, approximately $135 per square foot. 209 Wilber St is a home located in Wood County with nearby schools including Lake Elementary School, Lake Middle School, and Lake High School.
Ownership History
Date
Name
Owned For
Owner Type
Purchase Details
Closed on
Dec 10, 2010
Sold by
Barboza Diane K and Engle Jill
Bought by
Grigson James L and Grigson Sandra M
Current Estimated Value
Purchase Details
Closed on
Sep 25, 2003
Sold by
Estate Of Christopher Dimoff
Bought by
Barboza Diane K
Purchase Details
Closed on
Oct 16, 1997
Sold by
Goetz Alana K
Bought by
Dunn Jerry L and Dunn Martha N
Home Financials for this Owner
Home Financials are based on the most recent Mortgage that was taken out on this home.
Original Mortgage
$68,400
Interest Rate
7.65%
Mortgage Type
New Conventional
Purchase Details
Closed on
Jan 14, 1994
Sold by
Gilbert Ii Edward E
Bought by
Gilbert Alana K
Purchase Details
Closed on
Nov 30, 1987
Bought by
Gilbert Ii Edward E
Create a Home Valuation Report for This Property
The Home Valuation Report is an in-depth analysis detailing your home's value as well as a comparison with similar homes in the area
Home Values in the Area
Average Home Value in this Area
Purchase History
| Date | Buyer | Sale Price | Title Company |
|---|---|---|---|
| Grigson James L | $30,200 | Attorney | |
| Barboza Diane K | -- | -- | |
| Dunn Jerry L | $72,000 | -- | |
| Gilbert Alana K | -- | -- | |
| Gilbert Ii Edward E | $29,000 | -- |
Source: Public Records
Mortgage History
| Date | Status | Borrower | Loan Amount |
|---|---|---|---|
| Previous Owner | Dunn Jerry L | $68,400 |
Source: Public Records
Tax History
| Year | Tax Paid | Tax Assessment Tax Assessment Total Assessment is a certain percentage of the fair market value that is determined by local assessors to be the total taxable value of land and additions on the property. | Land | Improvement |
|---|---|---|---|---|
| 2025 | $1,827 | $40,180 | $5,880 | $34,300 |
| 2024 | $1,822 | $40,180 | $5,880 | $34,300 |
| 2023 | $1,822 | $40,180 | $5,880 | $34,300 |
| 2021 | $1,763 | $33,110 | $5,880 | $27,230 |
| 2020 | $1,695 | $33,110 | $5,880 | $27,230 |
| 2019 | $1,565 | $28,180 | $5,880 | $22,300 |
| 2018 | $1,564 | $28,180 | $5,880 | $22,300 |
| 2017 | $1,465 | $28,180 | $5,880 | $22,300 |
| 2016 | $1,334 | $24,680 | $5,290 | $19,390 |
| 2015 | $1,334 | $24,680 | $5,290 | $19,390 |
| 2014 | $1,408 | $24,680 | $5,290 | $19,390 |
| 2013 | $816 | $27,410 | $5,880 | $21,530 |
Source: Public Records
Map
Nearby Homes
- 225 E Union St
- 114 E Perry St
- 100 W Union St
- 236 S Bridge Rd
- 238 S Bridge Rd
- 232 S Bridge Rd
- 241 S Bridge Rd
- 237 S Bridge Rd
- 30236 Lemoyne Rd
- 30348 Lemoyne Rd
- 5501 Ayers Rd
- 5668 Ayers Rd
- 3901 Plumey Rd
- 199 E Bridge Rd
- 0 Williston Rd
- 28574 Lemoyne Rd
- 204 Short St
- 3517 Goodrich Ave
- 115 W Bridge Rd
- 113 W Bridge Rd
Your Personal Tour Guide
Ask me questions while you tour the home.