Estimated Value: $320,748 - $350,000
3
Beds
2
Baths
1,593
Sq Ft
$211/Sq Ft
Est. Value
About This Home
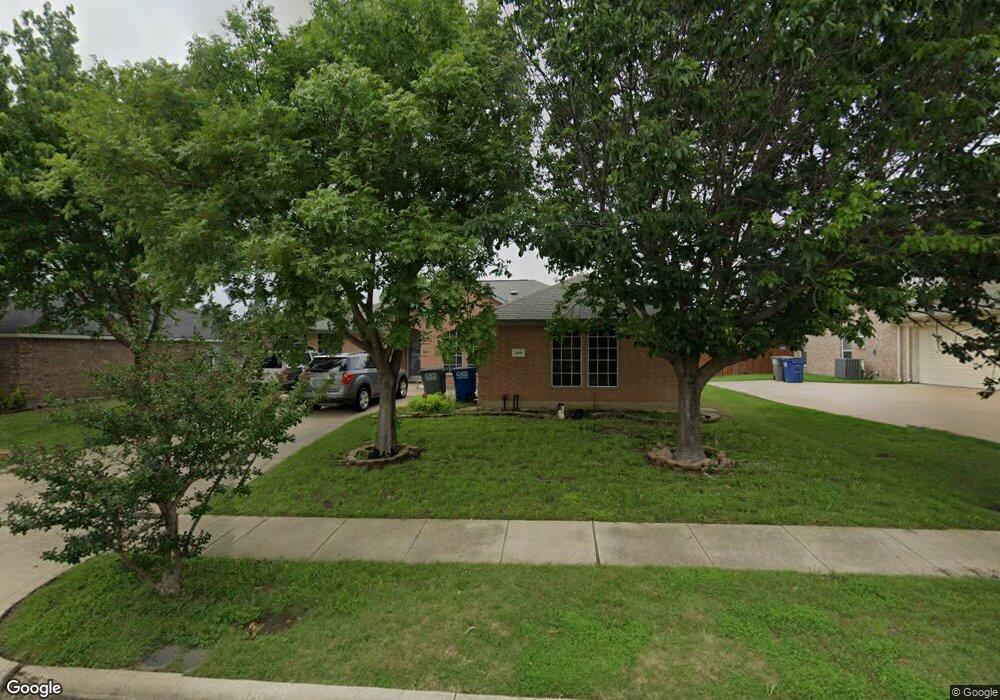
This home is located at 209 Windy Knoll Ln, Wylie, TX 75098 and is currently estimated at $336,437, approximately $211 per square foot. 209 Windy Knoll Ln is a home located in Collin County with nearby schools including P M Akin Elementary School, AB Harrison Intermediate School, and Grady Burnett J High School.
Ownership History
Date
Name
Owned For
Owner Type
Purchase Details
Closed on
May 15, 2008
Sold by
Va
Bought by
Lamb Charles Joseph
Current Estimated Value
Home Financials for this Owner
Home Financials are based on the most recent Mortgage that was taken out on this home.
Original Mortgage
$137,389
Outstanding Balance
$87,053
Interest Rate
5.89%
Mortgage Type
VA
Estimated Equity
$249,384
Purchase Details
Closed on
Dec 5, 2007
Sold by
Midland Mortgage Co
Bought by
Va
Purchase Details
Closed on
Nov 28, 2007
Sold by
Carr Jason M and Carr Nalani M
Bought by
Mortgage Electronic Registration Systems
Purchase Details
Closed on
Apr 11, 2002
Sold by
Choice Homes Inc
Bought by
Carr Jason M and Carr Nalani M
Home Financials for this Owner
Home Financials are based on the most recent Mortgage that was taken out on this home.
Original Mortgage
$131,144
Interest Rate
7.09%
Mortgage Type
VA
Create a Home Valuation Report for This Property
The Home Valuation Report is an in-depth analysis detailing your home's value as well as a comparison with similar homes in the area
Home Values in the Area
Average Home Value in this Area
Purchase History
| Date | Buyer | Sale Price | Title Company |
|---|---|---|---|
| Lamb Charles Joseph | -- | Natgf | |
| Va | -- | None Available | |
| Mortgage Electronic Registration Systems | -- | None Available | |
| Carr Jason M | -- | -- |
Source: Public Records
Mortgage History
| Date | Status | Borrower | Loan Amount |
|---|---|---|---|
| Open | Lamb Charles Joseph | $137,389 | |
| Previous Owner | Carr Jason M | $131,144 |
Source: Public Records
Tax History Compared to Growth
Tax History
| Year | Tax Paid | Tax Assessment Tax Assessment Total Assessment is a certain percentage of the fair market value that is determined by local assessors to be the total taxable value of land and additions on the property. | Land | Improvement |
|---|---|---|---|---|
| 2025 | $4,864 | $323,326 | $85,000 | $238,326 |
| 2024 | $4,864 | $311,454 | $85,000 | $241,551 |
| 2023 | $4,864 | $283,140 | $85,000 | $248,402 |
| 2022 | $5,061 | $257,400 | $70,000 | $226,025 |
| 2021 | $5,117 | $234,000 | $60,000 | $174,000 |
| 2020 | $5,449 | $219,466 | $60,000 | $159,466 |
| 2019 | $5,781 | $220,004 | $60,000 | $161,000 |
| 2018 | $5,386 | $200,004 | $50,000 | $157,000 |
| 2017 | $4,897 | $196,955 | $45,000 | $151,955 |
| 2016 | $4,593 | $170,373 | $33,000 | $137,373 |
| 2015 | $3,612 | $151,353 | $33,000 | $118,353 |
Source: Public Records
Map
Nearby Homes
- 107 Windy Knoll Ln
- 1056 Fairview Dr
- 213 N West A Allen Blvd
- 1209 Surrey Cir
- 1308 London Dr
- 1115 Nighthawk Dr
- 312 Maltese Cir
- 304 Hawthorn Dr
- 310 Hawthorn Dr
- 1312 Wyndham Dr
- 306 Foxwood Ct
- 409 Cedar Ridge Dr
- 407 Sparrow Dr
- 216 Cedar Ridge St
- 825 Foxwood Ln
- 1201 E Stone Rd
- 205 Duck Blind Ave
- 114 Liberty Dr
- 209 Duck Blind Ave
- 820 Foxwood Ln
- 207 Windy Knoll Ln
- 211 Windy Knoll Ln
- 208 N Rolling Meadows Dr
- 205 Windy Knoll Ln
- 206 N Rolling Meadows Dr
- 210 N Rolling Meadows Dr
- 208 Windy Knoll Ln
- 206 Windy Knoll Ln
- 204 N Rolling Meadows Dr
- 210 Windy Knoll Ln
- 210 Windy Knoll Ln
- 203 Windy Knoll Ln
- 204 Windy Knoll Ln
- 202 N Rolling Meadows Dr
- 202 Windy Knoll Ln
- 201 Windy Knoll Ln
- 1215 E Brown St
- 209 N Bending Oak Ln
- 209 N Rolling Meadows Dr
- 200 N Rolling Meadows Dr