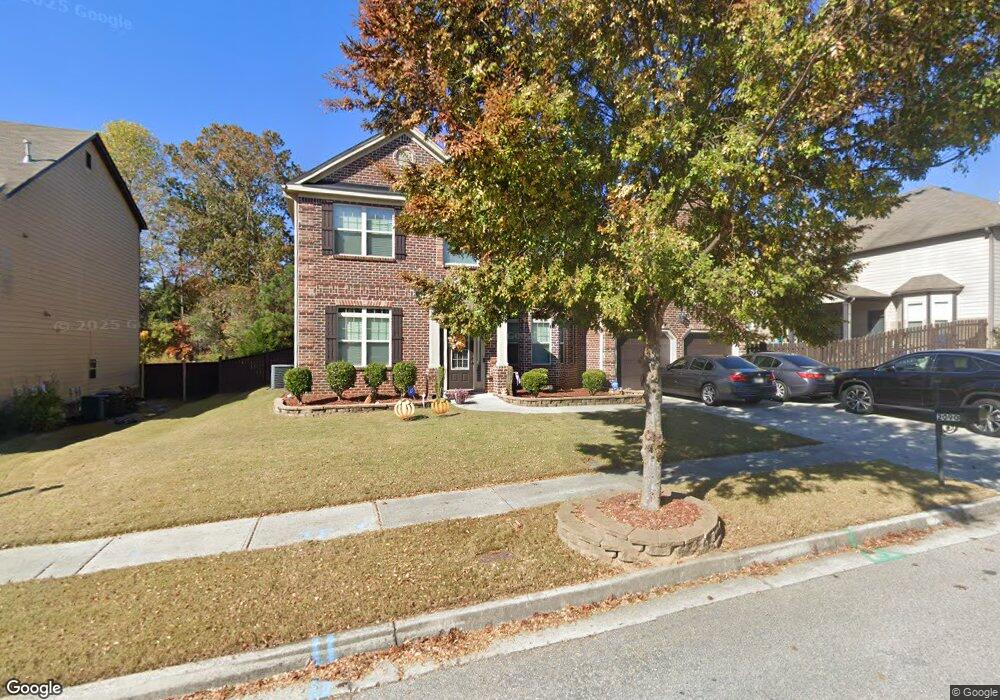
2090 Browning Bend Ct Unit LOT 51 Dacula, GA 30019
Estimated Value: $516,674 - $564,000
5
Beds
4
Baths
4,381
Sq Ft
$123/Sq Ft
Est. Value
About This Home
This home is located at 2090 Browning Bend Ct Unit LOT 51, Dacula, GA 30019 and is currently estimated at $538,419, approximately $122 per square foot. 2090 Browning Bend Ct Unit LOT 51 is a home located in Gwinnett County with nearby schools including Harbins Elementary School, McConnell Middle School, and Archer High School.
Ownership History
Date
Name
Owned For
Owner Type
Purchase Details
Closed on
May 10, 2019
Sold by
Stewart Maurice Antonio
Bought by
Boone Frank T and Houston-Boone Mary A
Current Estimated Value
Home Financials for this Owner
Home Financials are based on the most recent Mortgage that was taken out on this home.
Original Mortgage
$319,113
Outstanding Balance
$282,894
Interest Rate
4.62%
Mortgage Type
FHA
Estimated Equity
$255,525
Purchase Details
Closed on
Nov 13, 2014
Sold by
Dr Horton Crown Llc
Bought by
Stewart Maurice Antonio
Home Financials for this Owner
Home Financials are based on the most recent Mortgage that was taken out on this home.
Original Mortgage
$273,518
Interest Rate
4%
Mortgage Type
VA
Purchase Details
Closed on
May 8, 2014
Sold by
Jefferson Homes Inc
Bought by
D R Horton Crown Llc
Purchase Details
Closed on
Apr 15, 2014
Sold by
Austin Commons Holdings Ll
Bought by
Jefferson Homes Inc
Create a Home Valuation Report for This Property
The Home Valuation Report is an in-depth analysis detailing your home's value as well as a comparison with similar homes in the area
Home Values in the Area
Average Home Value in this Area
Purchase History
| Date | Buyer | Sale Price | Title Company |
|---|---|---|---|
| Boone Frank T | $325,000 | -- | |
| Stewart Maurice Antonio | $273,518 | -- | |
| D R Horton Crown Llc | $2,676,418 | -- | |
| Jefferson Homes Inc | $28,500 | -- |
Source: Public Records
Mortgage History
| Date | Status | Borrower | Loan Amount |
|---|---|---|---|
| Open | Boone Frank T | $319,113 | |
| Previous Owner | Stewart Maurice Antonio | $273,518 |
Source: Public Records
Tax History Compared to Growth
Tax History
| Year | Tax Paid | Tax Assessment Tax Assessment Total Assessment is a certain percentage of the fair market value that is determined by local assessors to be the total taxable value of land and additions on the property. | Land | Improvement |
|---|---|---|---|---|
| 2024 | $7,106 | $189,560 | $36,000 | $153,560 |
| 2023 | $7,106 | $206,400 | $38,000 | $168,400 |
| 2022 | $6,017 | $159,680 | $31,600 | $128,080 |
| 2021 | $5,153 | $133,240 | $28,000 | $105,240 |
| 2020 | $4,845 | $123,920 | $24,000 | $99,920 |
| 2019 | $1,447 | $123,920 | $24,000 | $99,920 |
| 2018 | $1,454 | $117,160 | $21,600 | $95,560 |
| 2016 | $3,882 | $106,760 | $16,000 | $90,760 |
| 2015 | $3,845 | $106,760 | $16,000 | $90,760 |
| 2014 | $673 | $11,400 | $11,400 | $0 |
Source: Public Records
Map
Nearby Homes
- 2040 Browning Bend Ct
- 2328 Austin Common Way
- 1860 Browning Bend Ct
- 2704 Olivine Dr
- 2964 Olivine Dr
- 1961 Vidalia Ct
- 2614 Dolostone Way
- 2705 Luke Edwards Rd
- 2967 Dolostone Way
- 1700 Cobblefield Cir
- 1741 Cobblefield Cir
- 1941 Cobblefield Cir
- 1751 Cobblefield Cir
- 1899 Redfern Rd
- 2694 Palm Creek Ct
- 2860 Windsor Knoll Dr
- 2498 Luke Edwards Rd
- 2790 Alcovy River View
- 1790 Alcovy River Dr
- 2090 Browning Bend Ct
- 2090 Browning Way Ct
- 2080 Browning Bend Ct
- 2100 Browning Bend Ct
- 2219 Austin Common Way Unit LOT 36
- 2219 Austin Common Way
- 2091 Browning Bend Ct
- 2091 Browning Bend Ct Unit LOT 50
- 2091 Browning Way Ct
- 2081 Browning Bend Ct
- 2081 Browning Bend Ct Unit LOT 49
- 2101 Browning Bend Ct
- 0 Austin Common Way Unit 8634894
- 0 Austin Common Way Unit 8392769
- 0 Austin Common Way Unit 8441991
- 0 Austin Common Way Unit 8952828
- 0 Austin Common Way Unit 8978871
- 0 Austin Common Way Unit 9021357
- 0 Austin Common Way Unit 9008586
- 0 Austin Common Way Unit 8889240