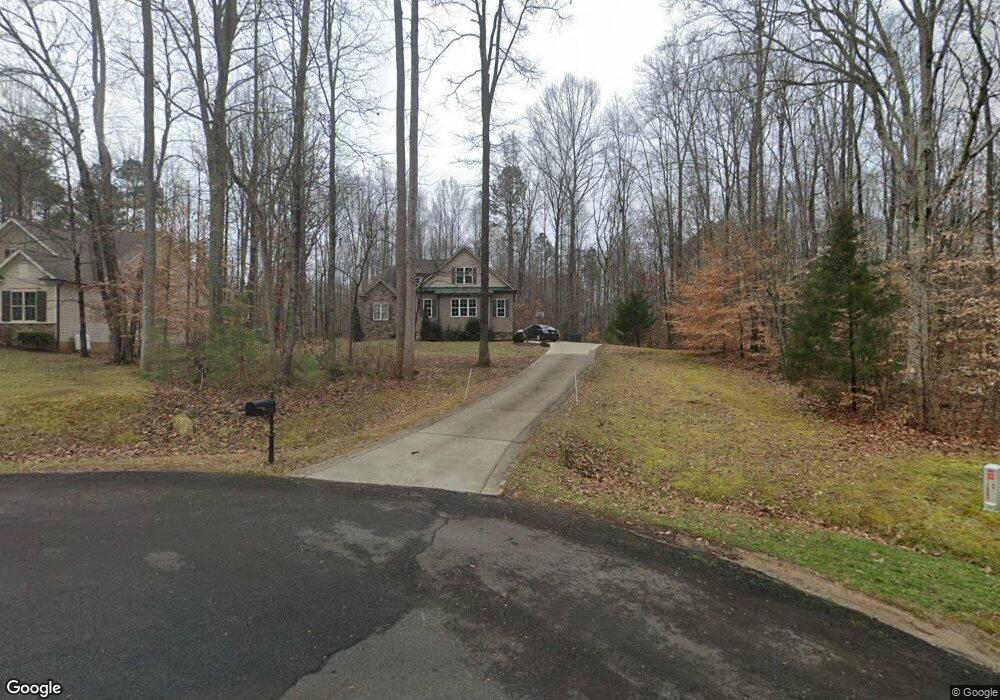
2090 Creekside Dr Unit 88 Franklinton, NC 27525
Estimated Value: $474,000 - $603,908
3
Beds
3
Baths
2,661
Sq Ft
$209/Sq Ft
Est. Value
About This Home
This home is located at 2090 Creekside Dr Unit 88, Franklinton, NC 27525 and is currently estimated at $555,977, approximately $208 per square foot. 2090 Creekside Dr Unit 88 is a home located in Granville County with nearby schools including Wilton Elementary School, C.G. Credle Elementary School, and G.C. Hawley Middle School.
Ownership History
Date
Name
Owned For
Owner Type
Purchase Details
Closed on
Nov 8, 2019
Sold by
Cranmer Sean Ross and Cranmer Auna Brewer
Bought by
Martin John N and Martin Jocelyn
Current Estimated Value
Home Financials for this Owner
Home Financials are based on the most recent Mortgage that was taken out on this home.
Original Mortgage
$276,000
Outstanding Balance
$242,809
Interest Rate
3.6%
Mortgage Type
New Conventional
Estimated Equity
$313,168
Purchase Details
Closed on
Dec 10, 2018
Sold by
Wittmann Erik and Rogers Paula Gertrude
Bought by
Cranmer Sean Ross and Cranmer Anna Brewer
Home Financials for this Owner
Home Financials are based on the most recent Mortgage that was taken out on this home.
Original Mortgage
$342,950
Interest Rate
4.8%
Mortgage Type
New Conventional
Purchase Details
Closed on
Apr 17, 2015
Sold by
High Cotton Assets Llc
Bought by
Wittmann Erik
Create a Home Valuation Report for This Property
The Home Valuation Report is an in-depth analysis detailing your home's value as well as a comparison with similar homes in the area
Home Values in the Area
Average Home Value in this Area
Purchase History
| Date | Buyer | Sale Price | Title Company |
|---|---|---|---|
| Martin John N | $345,000 | None Available | |
| Cranmer Sean Ross | $361,000 | None Available | |
| Wittmann Erik | $317,500 | None Available |
Source: Public Records
Mortgage History
| Date | Status | Borrower | Loan Amount |
|---|---|---|---|
| Open | Martin John N | $276,000 | |
| Previous Owner | Cranmer Sean Ross | $342,950 |
Source: Public Records
Tax History Compared to Growth
Tax History
| Year | Tax Paid | Tax Assessment Tax Assessment Total Assessment is a certain percentage of the fair market value that is determined by local assessors to be the total taxable value of land and additions on the property. | Land | Improvement |
|---|---|---|---|---|
| 2025 | $3,919 | $567,292 | $66,500 | $500,792 |
| 2024 | $3,919 | $567,292 | $66,500 | $500,792 |
| 2023 | $3,916 | $366,619 | $45,000 | $321,619 |
| 2022 | $3,331 | $366,619 | $45,000 | $321,619 |
| 2021 | $3,106 | $366,619 | $45,000 | $321,619 |
| 2020 | $3,106 | $366,619 | $45,000 | $321,619 |
| 2019 | $1,798 | $366,619 | $45,000 | $321,619 |
| 2018 | $3,106 | $366,619 | $45,000 | $321,619 |
| 2016 | $2,805 | $308,485 | $45,000 | $263,485 |
| 2015 | $1,962 | $235,908 | $45,000 | $190,908 |
| 2014 | $321 | $38,250 | $38,250 | $0 |
| 2013 | -- | $38,250 | $38,250 | $0 |
Source: Public Records
Map
Nearby Homes
- 3828 Saint Lucy Dr
- 2103 Troys Trail
- 2122 Olde Brassfield Ln
- 4056 Ridgeway Dr
- 4138 Geneva Dr
- 2128 Turquoise Ln
- 2030 Lonesome Dove Dr
- 4106 Geneva Dr
- 3718 Sapphire Ct
- 1731 Riverstone Dr
- 1633 Carriage Dr
- 3855 Ironwood Dr
- 2482 Patton Ln
- 1726 Rapids Ct
- 1710 Eddy Ct
- 2488 Patton Ln
- 2508 Patton Ln
- 2069 Tart Dr Unit 13
- 1723 River Club Way
- 3627 River Watch Ln
- 2090 Creekside Dr
- 2092 Creekside Dr
- 2092 Creekside Dr Unit 87
- 1713 Creekside Dr Unit Lt 87
- 1713 Creekside Dr
- 3836 St Lucy Dr
- 3836 St Lucy Dr Unit 16
- 3836 Saint Lucy Dr
- 3836 Saint Lucy Dr Unit 16
- 2091 Creekside Dr Unit 89
- 2091 Creekside Dr
- 2094 Creekside Dr
- 2094 Creekside Dr Unit Lot86
- 3654 Coughlin Ct Unit 82
- 3654 Coughlin Ct
- 3834 St Lucy Dr Unit 17
- 3834 St Lucy Dr
- 3834 Saint Lucy Dr
- 3834 Saint Lucy Dr Unit 17
- 2094 Troys Trail