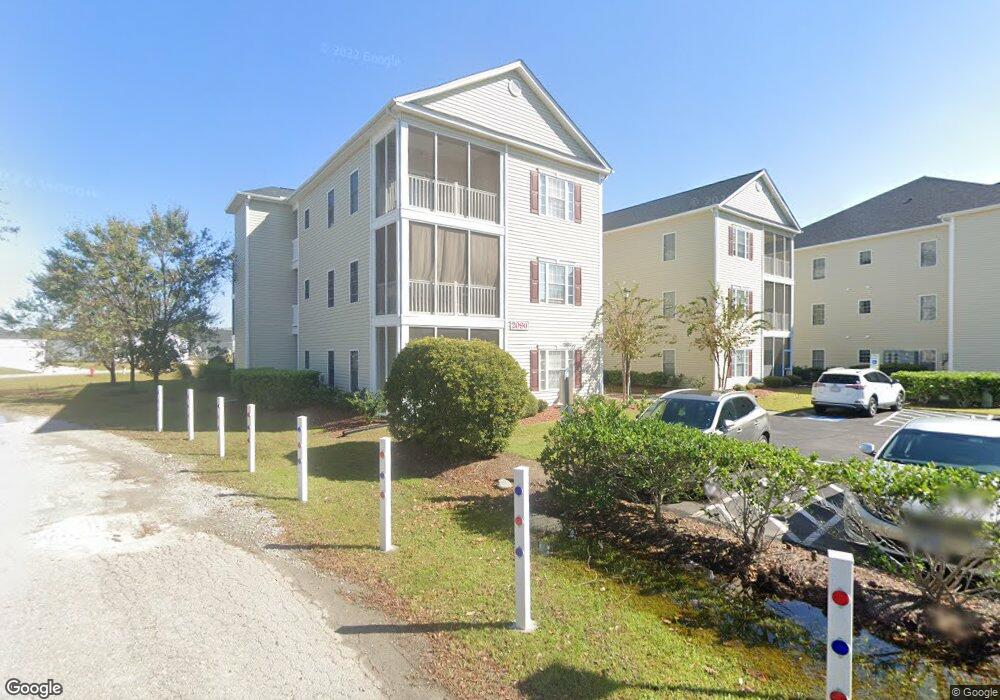
2090 Cross Gate Blvd Unit 20903 Myrtle Beach, SC 29575
Estimated Value: $171,000 - $181,000
2
Beds
2
Baths
964
Sq Ft
$183/Sq Ft
Est. Value
About This Home
This home is located at 2090 Cross Gate Blvd Unit 20903, Myrtle Beach, SC 29575 and is currently estimated at $176,754, approximately $183 per square foot. 2090 Cross Gate Blvd Unit 20903 is a home located in Horry County with nearby schools including Lakewood Elementary, Socastee Middle, and Socastee High School.
Ownership History
Date
Name
Owned For
Owner Type
Purchase Details
Closed on
Feb 19, 2025
Sold by
Chelsea Home Rentals Llc
Bought by
White Jon Garth and White Melissa Ann
Current Estimated Value
Purchase Details
Closed on
Feb 11, 2021
Sold by
Ford Larry L
Bought by
Chelsea Home Rentals Llc
Purchase Details
Closed on
Jun 30, 2017
Sold by
Herring Amber Faith
Bought by
Denise Ford Larry L and Denise Linda
Purchase Details
Closed on
Jun 22, 2010
Sold by
Herring Dwight N
Bought by
Herring Amber Faith
Purchase Details
Closed on
Nov 6, 2007
Sold by
Smith & Smith Properties Llc
Bought by
Herring Dwight N and Herring Justin M
Home Financials for this Owner
Home Financials are based on the most recent Mortgage that was taken out on this home.
Original Mortgage
$99,000
Interest Rate
6.32%
Mortgage Type
Construction
Purchase Details
Closed on
May 24, 2007
Sold by
Smith & Smith Properties Llc
Bought by
Alexander Anthony S
Create a Home Valuation Report for This Property
The Home Valuation Report is an in-depth analysis detailing your home's value as well as a comparison with similar homes in the area
Home Values in the Area
Average Home Value in this Area
Purchase History
| Date | Buyer | Sale Price | Title Company |
|---|---|---|---|
| White Jon Garth | $172,500 | -- | |
| Chelsea Home Rentals Llc | $110,000 | -- | |
| Denise Ford Larry L | $86,000 | -- | |
| Herring Amber Faith | -- | -- | |
| Herring Dwight N | $110,000 | Attorney | |
| Alexander Anthony S | $160,000 | Attorney |
Source: Public Records
Mortgage History
| Date | Status | Borrower | Loan Amount |
|---|---|---|---|
| Previous Owner | Herring Dwight N | $99,000 |
Source: Public Records
Tax History Compared to Growth
Tax History
| Year | Tax Paid | Tax Assessment Tax Assessment Total Assessment is a certain percentage of the fair market value that is determined by local assessors to be the total taxable value of land and additions on the property. | Land | Improvement |
|---|---|---|---|---|
| 2024 | $1,685 | $9,900 | $0 | $9,900 |
| 2023 | $1,685 | $9,450 | $0 | $9,450 |
| 2021 | $1,557 | $9,450 | $0 | $9,450 |
| 2020 | $1,152 | $9,450 | $0 | $9,450 |
| 2019 | $1,152 | $9,450 | $0 | $9,450 |
| 2018 | $0 | $8,663 | $0 | $8,663 |
| 2017 | $808 | $3,660 | $0 | $3,660 |
| 2016 | -- | $3,660 | $0 | $3,660 |
| 2015 | $808 | $6,405 | $0 | $6,405 |
| 2014 | $782 | $3,660 | $0 | $3,660 |
Source: Public Records
Map
Nearby Homes
- 2090 Cross Gate Blvd Unit 205
- 2050 Cross Gate Blvd Unit 303
- 2050 Cross Gate Blvd Unit 201
- Lot 2 Deerfield Links Dr
- Lot 1 Deerfield Links Dr
- 2040 Cross Gate Blvd Unit 301
- 2170 Deerfield Ave
- 101 Maddington Place Dr Unit 103
- 2020 Cross Gate Blvd Unit 203
- 2020 Cross Gate Blvd Unit 102
- 2000 Cross Gate Blvd Unit 102
- 315 N Reindeer Rd
- 1950 Bent Grass Dr Unit C
- 455 Deerfield Links Dr
- 1943 Bent Grass Dr Unit H
- 155 Marsh Deer Place
- 208 Sutter Dr
- 1409 Ashwood Cir
- 1920 Bent Grass Dr Unit 34-I
- 1920 Bent Grass Dr Unit 35-i
- 2090 Cross Gate Blvd Unit 304
- 2090 Cross Gate Blvd Unit Maddington Place- De
- 2090 Cross Gate Blvd Unit 203
- 2090 Cross Gate Blvd Unit Maddington Place Uni
- 2090 Cross Gate Blvd
- 2090 Cross Gate Blvd Unit 20
- 2090 Cross Gate Blvd Unit 20901
- 2090 Cross Gate Blvd Unit 20903
- 2090 Cross Gate Blvd Unit 20903
- 2090 Cross Gate Blvd Unit 20903
- 2090 Cross Gate Blvd Unit 20903
- 2090 Cross Gate Blvd Unit 20902
- 2090 Cross Gate Blvd Unit 20902
- 2090 Cross Gate Blvd Unit 20902
- 2090 Cross Gate Blvd Unit 20901
- 2090 Cross Gate Blvd Unit 20902
- 2090 Cross Gate Blvd Unit 20902
- 2090 Cross Gate Blvd Unit 20901
- 2090 Cross Gate Blvd Unit 20901
- 2090 Cross Gate Blvd