NOT LISTED FOR SALE

2090 Cross Gate Blvd Myrtle Beach, SC 29575

Estimated Value: $201,000 - $218,000

2 Beds
2 Baths
1,064 Sq Ft
$199/Sq Ft Est. Value

Last Sold February 11, 2021

Last sale price $110,000 $103 Per Sq Ft

Est. 92% increase in value since last sale

Current estimated payment $1,341/month

About This Home

As of February 2021

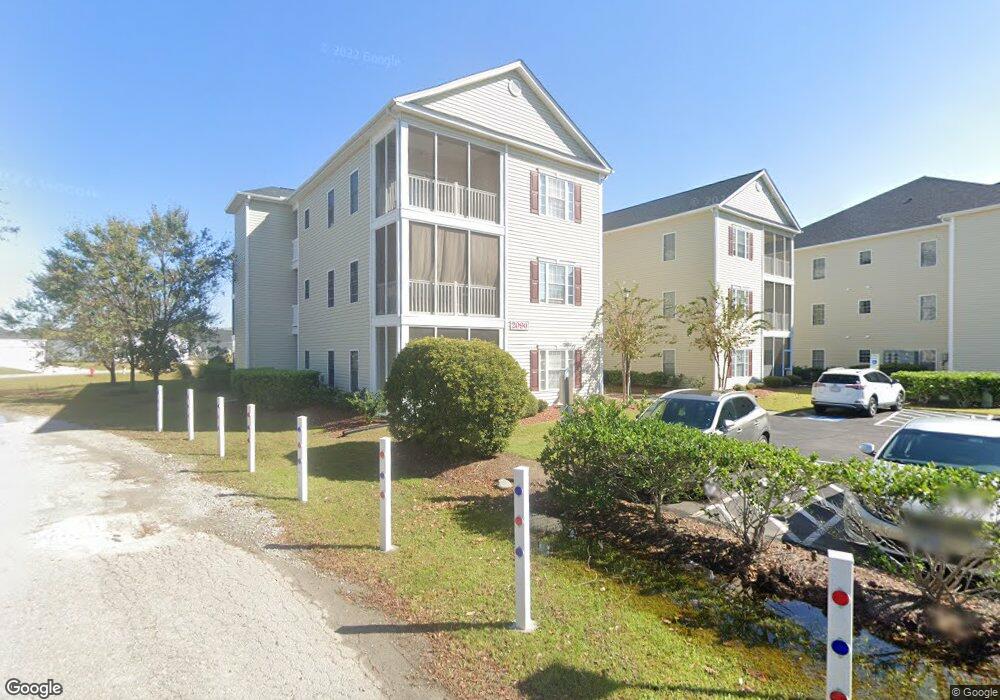
This is a bright and airy 2 bedroom condo located on the edge of Surfside Beach and Myrtle Beach. This floorplan has a nice flow as you enter through the foyer and drawn the screened balcony past the living room. A new hvac and refrigerator were installed last year. This spacious end unit condo comes completely furnished. Either a short stroll to the pool that over looks pond or a 2.5 mile drive to the ocean makes it a perfect way to spend your day. Also near by is Market Commons which hosts some of the best boutique shopping and dinning in our area.

Ownership History

Date Name Owned For Owner Type

Purchase Details

Closed on
Apr 20, 2017
Sold by
Reda Frank J
Bought by
Peterson Carl B and Peterson Kathryn M
Current Estimated Value
$211,550

Purchase Details

Closed on
Jul 11, 2016
Sold by
Alexander Anthony S
Bought by
Johnson Clare A Trust

Purchase Details

Closed on
Dec 19, 2006
Sold by
Smith & Smith Properties Llc
Bought by
Palmer Ronald C

Purchase Details

Closed on
Nov 8, 2006
Sold by
Smith & Smith Properties Llc
Bought by
Reds Frank J and Reda Joyce T
Source: Public Records

Range of Values:

Collateral Analytics

Collateral Analytics Collateral Analytics AVMs (Automated Valuation Model) employ a number of statistical approaches combined with neighborhood-specific comparable selection guarantees the most up-to-date and precise valuations.

Not Available

Collateral Analytics does not have data for the current month. Please view the chart for historical values.

ICE

ICE Mortgage Technology ICE Mortgage Technology’s AVM (Automated Valuation Model) is a state-of-the-art online residential property valuation tool that provides a quick and accurate estimate of the value of almost any home in the U.S.

Not Available

ICE Mortgage Technology does not have data for the current month. Please view the chart for historical values.

First American

First American First American Data & Analytics’ next-generation AVM combines unrivaled data assets with a blended ensemble of valuation models to produce highly accurate, reliable valuations you can trust.

Not Available

First American does not have data for the current month. Please view the chart for historical values.

Quantarium

Quantarium Quantarium’s valuation service, repeatedly proven the industry’s most accurate and comprehensive, is supercharged with a self-learning and auto-tuning AI engine that continually becomes smarter and more accurate as it processes daily inputs from the industry’s leading RE data lake.

Not Available

Quantarium does not have data for the current month. Please view the chart for historical values.

Average Value
Not Available
List Price
Sold Price
Create a Home Valuation Report for This Property
The Home Valuation Report is an in-depth analysis detailing your home's value as well as a comparison with similar homes in the area

Home Values in the Area

Source: Public Records

Average Home Value in this Area


Source: Public Records

Purchase History

Date Buyer Sale Price Title Company
Peterson Carl B $112,000 --
Johnson Clare A Trust $114,000 --
Palmer Ronald C $135,000 None Available
Reds Frank J $148,200 None Available
Source: Public Records

Property History

Date Event Price Change Sq Ft Price
02/11/2021 02/11/21 Sold $110,000 -4.3% $114 / Sq Ft
12/08/2020 12/08/20 For Sale $115,000 -- $119 / Sq Ft

Tax History Compared to Growth

Source: Public Records

Tax History

Year Tax Paid Tax Assessment Tax Assessment Total Assessment is a certain percentage of the fair market value that is determined by local assessors to be the total taxable value of land and additions on the property. Land Improvement
2024 -- $13,950 $0 $13,950
2023 $0 $12,810 $0 $12,810
2021 $349 $12,810 $0 $12,810
2020 $283 $12,810 $0 $12,810
2019 $283 $12,810 $0 $12,810
2018 $0 $10,815 $0 $10,815
2017 -- $10,815 $0 $10,815
2016 -- $8,925 $0 $8,925
2015 $1,114 $8,925 $0 $8,925
2014 $1,077 $5,100 $0 $5,100
Source: Public Records

Agents Affiliated with this Home

  • Section Image
  • Section Image
See All Agents

Map