Estimated Value: $339,998 - $401,000
2
Beds
1
Bath
1,171
Sq Ft
$318/Sq Ft
Est. Value
About This Home
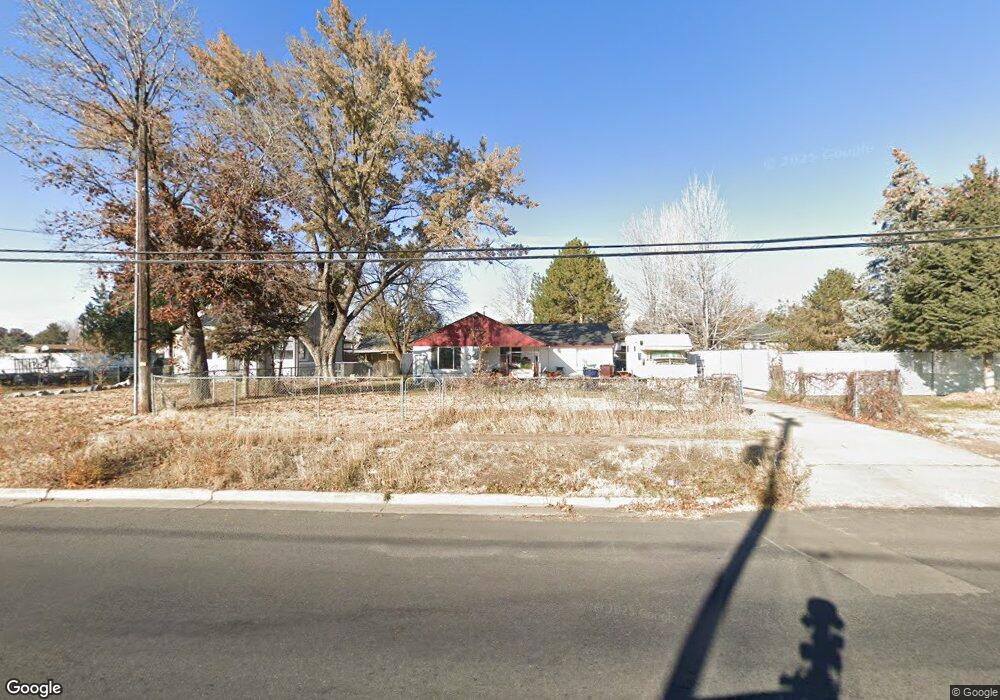
This home is located at 2090 W 4400 S, Roy, UT 84067 and is currently estimated at $372,500, approximately $318 per square foot. 2090 W 4400 S is a home located in Weber County with nearby schools including North Park School, Sand Ridge Junior High School, and Roy High School.
Ownership History
Date
Name
Owned For
Owner Type
Purchase Details
Closed on
Mar 10, 2014
Sold by
Michaels Christy Lynn Maynard
Bought by
Cevering Laree
Current Estimated Value
Home Financials for this Owner
Home Financials are based on the most recent Mortgage that was taken out on this home.
Original Mortgage
$87,829
Outstanding Balance
$66,164
Interest Rate
4.18%
Mortgage Type
FHA
Estimated Equity
$306,336
Purchase Details
Closed on
Sep 22, 2005
Sold by
Maynard David Troy
Bought by
Maynard Wilma J
Home Financials for this Owner
Home Financials are based on the most recent Mortgage that was taken out on this home.
Original Mortgage
$76,300
Interest Rate
5.72%
Mortgage Type
Fannie Mae Freddie Mac
Purchase Details
Closed on
May 23, 2002
Sold by
Maynard Wilma J
Bought by
Maynard Wilma J and Maynard David Troy
Create a Home Valuation Report for This Property
The Home Valuation Report is an in-depth analysis detailing your home's value as well as a comparison with similar homes in the area
Home Values in the Area
Average Home Value in this Area
Purchase History
| Date | Buyer | Sale Price | Title Company |
|---|---|---|---|
| Cevering Laree | -- | Silver Leaf Title Ins Agency | |
| Maynard Wilma J | -- | First American Title | |
| Maynard Wilma J | -- | Associated Title |
Source: Public Records
Mortgage History
| Date | Status | Borrower | Loan Amount |
|---|---|---|---|
| Open | Cevering Laree | $87,829 | |
| Previous Owner | Maynard Wilma J | $76,300 |
Source: Public Records
Tax History Compared to Growth
Tax History
| Year | Tax Paid | Tax Assessment Tax Assessment Total Assessment is a certain percentage of the fair market value that is determined by local assessors to be the total taxable value of land and additions on the property. | Land | Improvement |
|---|---|---|---|---|
| 2025 | $1,189 | $323,413 | $122,302 | $201,111 |
| 2024 | $1,167 | $174,898 | $66,986 | $107,912 |
| 2023 | $1,117 | $167,200 | $60,926 | $106,274 |
| 2022 | $1,870 | $162,250 | $52,617 | $109,633 |
| 2021 | $1,388 | $193,001 | $67,435 | $125,566 |
| 2020 | $1,233 | $156,000 | $67,435 | $88,565 |
| 2019 | $1,159 | $137,000 | $39,661 | $97,339 |
| 2018 | $1,021 | $111,001 | $36,825 | $74,176 |
| 2017 | $1,066 | $110,574 | $36,825 | $73,749 |
| 2016 | $992 | $54,770 | $17,178 | $37,592 |
| 2015 | $965 | $54,770 | $17,178 | $37,592 |
| 2014 | $971 | $54,770 | $17,622 | $37,148 |
Source: Public Records
Map
Nearby Homes
- 2082 W 4450 S
- 4328 S 2175 W
- 4475 S 1975 W
- 2015 W 4225 S
- 4220 S 2075 W
- 2263 W 4400 S
- 4205 S 2075 W
- 2259 W 4525 S
- 2038 W 4600 S
- 1825 W 4400 S
- 4536 S 1900 W Unit 12
- 4642 S 1900 W Unit 41
- 1825 W 4500 S Unit 101
- 4073 S 2175 W
- 4110 S 2275 W
- 4164 S 2400 W
- 1766 W 4575 S
- 2070 W 4000 S
- 2050 W 4000 S
- 4501 S 1720 W