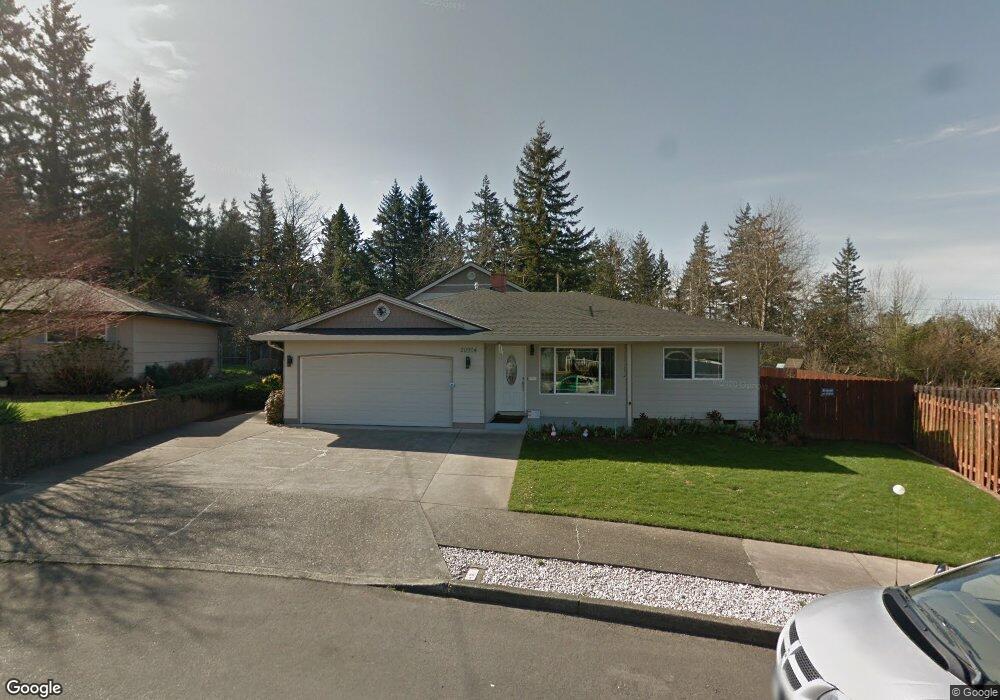
20904 SE Clay Ct Gresham, OR 97030
Northwest Gresham NeighborhoodEstimated Value: $381,255
3
Beds
1
Bath
1,280
Sq Ft
$298/Sq Ft
Est. Value
About This Home
This home is located at 20904 SE Clay Ct, Gresham, OR 97030 and is currently estimated at $381,255, approximately $297 per square foot. 20904 SE Clay Ct is a home located in Multnomah County with nearby schools including North Gresham Elementary School, Clear Creek Middle School, and Gresham High School.
Ownership History
Date
Name
Owned For
Owner Type
Purchase Details
Closed on
Mar 17, 2026
Sold by
George Turc and Anna Turc
Bought by
George And Anna Turc Trust and Turc
Current Estimated Value
Purchase Details
Closed on
Jul 26, 2013
Sold by
Turc George
Bought by
Turc George and Turc Anna
Home Financials for this Owner
Home Financials are based on the most recent Mortgage that was taken out on this home.
Original Mortgage
$80,000
Interest Rate
3.92%
Mortgage Type
Commercial
Purchase Details
Closed on
Oct 28, 2003
Sold by
Pooschke Mark J
Bought by
Turc Gheorghe and Turc Anuta
Home Financials for this Owner
Home Financials are based on the most recent Mortgage that was taken out on this home.
Original Mortgage
$113,200
Interest Rate
5.98%
Mortgage Type
Commercial
Purchase Details
Closed on
Dec 14, 1998
Sold by
Swarts Elizabeth A
Bought by
Pooschke Mark J and Carter Christine M
Home Financials for this Owner
Home Financials are based on the most recent Mortgage that was taken out on this home.
Original Mortgage
$131,920
Interest Rate
6.86%
Mortgage Type
Commercial
Create a Home Valuation Report for This Property
The Home Valuation Report is an in-depth analysis detailing your home's value as well as a comparison with similar homes in the area
Home Values in the Area
Average Home Value in this Area
Purchase History
| Date | Buyer | Sale Price | Title Company |
|---|---|---|---|
| George And Anna Turc Trust | -- | None Listed On Document | |
| Turc George | -- | Stewart Title | |
| Turc Gheorghe | $141,500 | Fidelity Natl Title Co Of Or | |
| Pooschke Mark J | $136,000 | Pacific Nw Title |
Source: Public Records
Mortgage History
| Date | Status | Borrower | Loan Amount |
|---|---|---|---|
| Previous Owner | Turc George | $80,000 | |
| Previous Owner | Turc Gheorghe | $113,200 | |
| Previous Owner | Pooschke Mark J | $131,920 |
Source: Public Records
Tax History
| Year | Tax Paid | Tax Assessment Tax Assessment Total Assessment is a certain percentage of the fair market value that is determined by local assessors to be the total taxable value of land and additions on the property. | Land | Improvement |
|---|---|---|---|---|
| 2025 | $8,058 | $396,000 | -- | -- |
| 2024 | $7,714 | $384,470 | -- | -- |
| 2023 | $7,028 | $373,280 | $0 | $0 |
| 2022 | $6,831 | $362,410 | $0 | $0 |
| 2021 | $6,659 | $351,860 | $0 | $0 |
| 2020 | $6,266 | $341,620 | $0 | $0 |
| 2019 | $6,102 | $331,670 | $0 | $0 |
| 2018 | $5,818 | $322,010 | $0 | $0 |
| 2017 | $5,582 | $312,640 | $0 | $0 |
| 2016 | $4,922 | $303,540 | $0 | $0 |
| 2015 | $4,815 | $294,700 | $0 | $0 |
| 2014 | $4,698 | $286,120 | $0 | $0 |
Source: Public Records
Map
Nearby Homes
- 21033 SE Clay Ct
- 1811 NW 19th St
- 2013 NW Bella Vista Dr
- 1861 NW Wonderview Ave
- 1596 NW Riverview Ave
- 1387 NW Riverview Ave Unit 14B
- 70 NW Birdsdale Ave
- 21016 SE Stark St Unit 71
- 21016 SE Stark St Unit 69
- 1325 NW 9th St
- 21260 SE Stark St
- 21532 SE Alder St
- 21400 SE Stark St Unit 2
- 970 NW Wonderview Ct Unit 980
- 765 NW Angeline Ave
- 1745 NW 7th Place
- 0 SE Burnside St
- 209 SE 214th Ave
- 19776 SE Stark St Unit 147
- 21525 SE Oak St
- 20910 SE Clay Ct
- 20844 SE Hawthorne St
- 20832 SE Hawthorne St
- 20920 SE Clay Ct
- 20901 SE Clay Ct
- 20919 SE Clay Ct
- 20932 SE Clay Ct
- 1429 SE 209th Ave
- 1434 SE 209th Ave
- 20929 SE Clay Ct
- 1651 NW 19th St
- 1507 SE 210th Ave
- 1671 NW 19th St
- 1631 NW 19th St
- 20803 SE Hawthorne St
- 1691 NW 19th St
- 20816 SE Hawthorne St
- 21000 SE Clay Ct
- 1417 SE 209th Ave
- 1611 NW 19th St
Your Personal Tour Guide
Ask me questions while you tour the home.