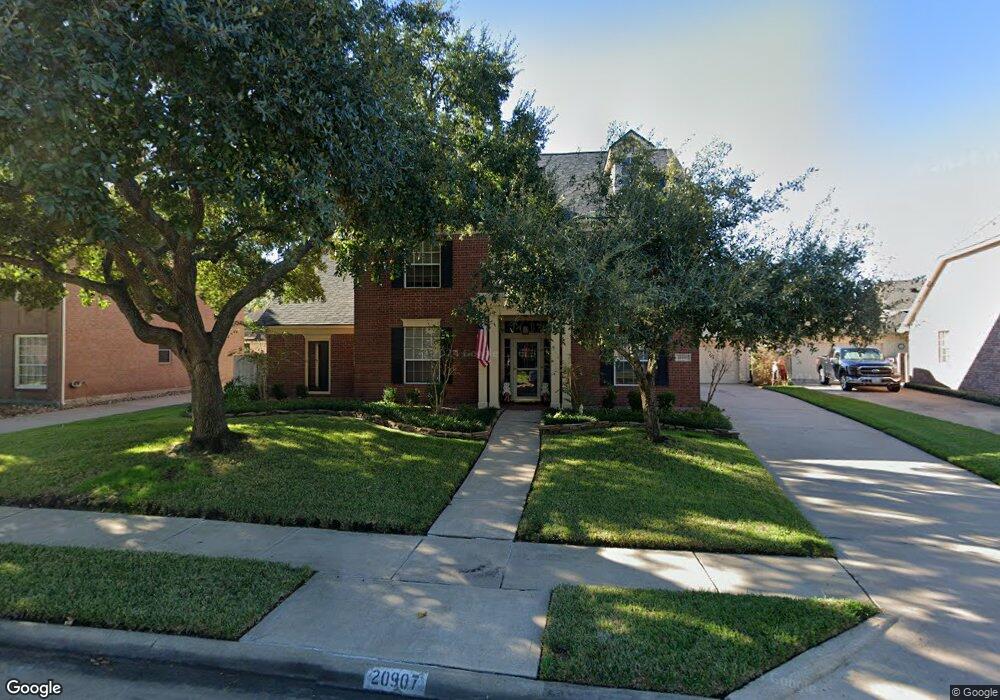
20907 Autumn Redwood Way Cypress, TX 77433
Fairfield Village NeighborhoodEstimated Value: $445,937 - $481,000
4
Beds
3
Baths
3,222
Sq Ft
$143/Sq Ft
Est. Value
About This Home
This home is located at 20907 Autumn Redwood Way, Cypress, TX 77433 and is currently estimated at $459,984, approximately $142 per square foot. 20907 Autumn Redwood Way is a home located in Harris County with nearby schools including Ault Elementary School, Salyards Middle, and Bridgeland High School.
Ownership History
Date
Name
Owned For
Owner Type
Purchase Details
Closed on
Dec 27, 2006
Sold by
Crow Grady E and Crow Susan
Bought by
Whetstine Mark R and Whetstine Nesha L
Current Estimated Value
Home Financials for this Owner
Home Financials are based on the most recent Mortgage that was taken out on this home.
Original Mortgage
$190,400
Outstanding Balance
$114,162
Interest Rate
6.27%
Mortgage Type
Purchase Money Mortgage
Estimated Equity
$345,822
Purchase Details
Closed on
Jul 31, 1998
Sold by
Cox Mark A and Cox Alisa C
Bought by
Crow Grady E and Crow Susan
Home Financials for this Owner
Home Financials are based on the most recent Mortgage that was taken out on this home.
Original Mortgage
$164,350
Interest Rate
6.94%
Purchase Details
Closed on
Oct 24, 1993
Sold by
Brewer Thomas A and Brewer Sandra P
Bought by
Cox Mark A and Cox Alisa C
Home Financials for this Owner
Home Financials are based on the most recent Mortgage that was taken out on this home.
Original Mortgage
$114,350
Interest Rate
6.86%
Create a Home Valuation Report for This Property
The Home Valuation Report is an in-depth analysis detailing your home's value as well as a comparison with similar homes in the area
Home Values in the Area
Average Home Value in this Area
Purchase History
| Date | Buyer | Sale Price | Title Company |
|---|---|---|---|
| Whetstine Mark R | -- | Etc | |
| Crow Grady E | -- | First American Title | |
| Cox Mark A | -- | -- |
Source: Public Records
Mortgage History
| Date | Status | Borrower | Loan Amount |
|---|---|---|---|
| Open | Whetstine Mark R | $190,400 | |
| Previous Owner | Crow Grady E | $164,350 | |
| Previous Owner | Cox Mark A | $114,350 |
Source: Public Records
Tax History Compared to Growth
Tax History
| Year | Tax Paid | Tax Assessment Tax Assessment Total Assessment is a certain percentage of the fair market value that is determined by local assessors to be the total taxable value of land and additions on the property. | Land | Improvement |
|---|---|---|---|---|
| 2025 | $4,476 | $376,188 | $84,465 | $291,723 |
| 2024 | $4,476 | $373,000 | $84,465 | $288,535 |
| 2023 | $4,476 | $427,000 | $84,465 | $342,535 |
| 2022 | $8,156 | $383,067 | $70,388 | $312,679 |
| 2021 | $7,849 | $293,300 | $70,388 | $222,912 |
| 2020 | $7,716 | $277,609 | $43,841 | $233,768 |
| 2019 | $7,719 | $268,877 | $37,406 | $231,471 |
| 2018 | $2,694 | $265,066 | $37,406 | $227,660 |
| 2017 | $7,757 | $277,863 | $37,406 | $240,457 |
| 2016 | $7,803 | $277,863 | $37,406 | $240,457 |
| 2015 | $4,020 | $267,540 | $37,406 | $230,134 |
| 2014 | $4,020 | $251,109 | $37,406 | $213,703 |
Source: Public Records
Map
Nearby Homes
- 20822 Chappell Knoll Dr
- 20806 Autumn Redwood Way
- 15503 Fairfield Falls Way
- 15434 Redbud Leaf Ln
- 15403 Redbud Leaf Ln
- 11018 White Caterpillar Dr
- 15002 Vista Heights Dr
- 15010 Vista Heights Dr
- 16018 Lower Lake Dr
- 15318 Redbud Berry Way
- 15311 Redbud Berry Way
- 15326 Wild Timber Trail
- 15122 Redbud Leaf Ln
- 15611 Garden Bend Cir
- 20434 Willow Trace Dr
- 20418 Scenic Woods Dr
- 15618 Meadow Palm Dr
- 20411 Garden Falls Ct
- 20315 Lakeland Falls Dr
- 15314 Rocky Bridge Ln
- 20911 Autumn Redwood Way
- 20903 Autumn Redwood Way
- 20910 Chappell Knoll Dr
- 20906 Chappell Knoll Dr
- 20827 Autumn Redwood Way
- 20915 Autumn Redwood Way
- 20914 Chappell Knoll Dr
- 20902 Chappell Knoll Dr
- 20906 Autumn Redwood Way
- 20910 Autumn Redwood Way
- 20918 Chappell Knoll Dr
- 20830 Chappell Knoll Dr
- 20823 Autumn Redwood Way
- 20822 Autumn Redwood Way
- 20914 Autumn Redwood Way
- 20922 Chappell Knoll Dr
- 20826 Chappell Knoll Dr
- 15523 Bluebonnet Dale Dr
- 20819 Autumn Redwood Way
- 20818 Autumn Redwood Way