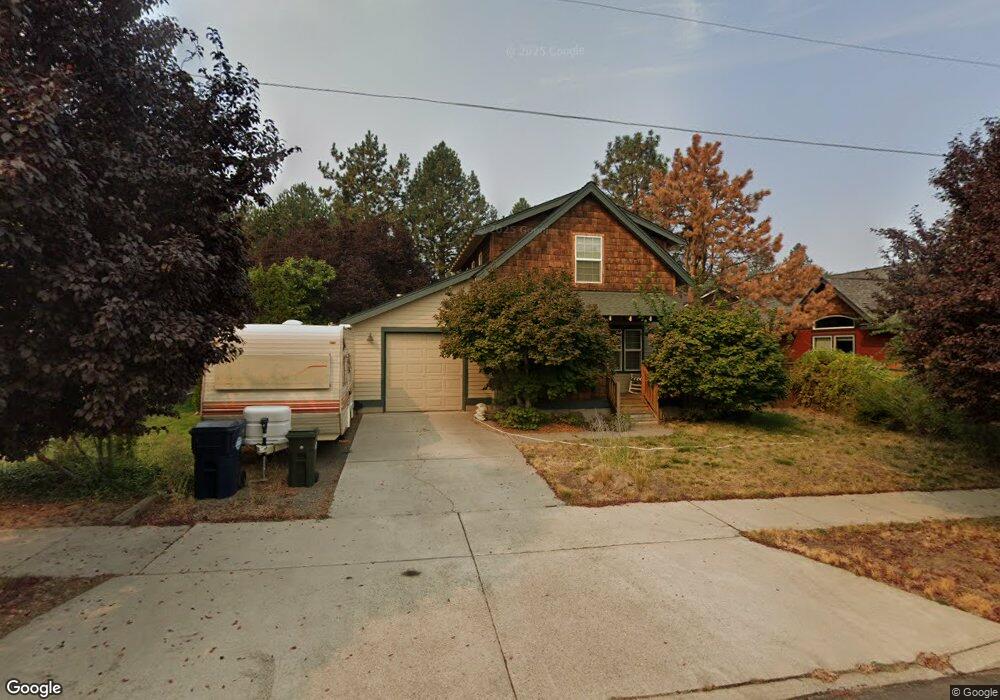
2091 NE 11th Place Bend, OR 97701
Orchard District NeighborhoodEstimated Value: $514,000 - $535,000
2
Beds
2
Baths
1,159
Sq Ft
$452/Sq Ft
Est. Value
About This Home
This home is located at 2091 NE 11th Place, Bend, OR 97701 and is currently estimated at $524,410, approximately $452 per square foot. 2091 NE 11th Place is a home located in Deschutes County with nearby schools including Juniper Elementary School, Bend Senior High School, and Desert Sky Montessori.
Ownership History
Date
Name
Owned For
Owner Type
Purchase Details
Closed on
Apr 14, 2017
Sold by
Mills Price Michael A and Mills Price Angela N
Bought by
Mills Price Michael A and Mills Price Angela N
Current Estimated Value
Purchase Details
Closed on
May 1, 2014
Sold by
Mills Price Michael A
Bought by
Mills Price Michael A and Mills Price Anglea N
Home Financials for this Owner
Home Financials are based on the most recent Mortgage that was taken out on this home.
Original Mortgage
$213,500
Outstanding Balance
$161,456
Interest Rate
4.28%
Mortgage Type
New Conventional
Estimated Equity
$362,954
Purchase Details
Closed on
Feb 27, 2008
Sold by
Vernon Guy
Bought by
Mills Price Michael A
Home Financials for this Owner
Home Financials are based on the most recent Mortgage that was taken out on this home.
Original Mortgage
$227,500
Interest Rate
5.64%
Mortgage Type
Unknown
Purchase Details
Closed on
Jan 17, 2007
Sold by
Bonanza Mtn Development Llc
Bought by
Vernon Guy
Create a Home Valuation Report for This Property
The Home Valuation Report is an in-depth analysis detailing your home's value as well as a comparison with similar homes in the area
Home Values in the Area
Average Home Value in this Area
Purchase History
| Date | Buyer | Sale Price | Title Company |
|---|---|---|---|
| Mills Price Michael A | -- | None Available | |
| Mills Price Michael A | -- | First American Title | |
| Mills Price Michael A | $240,900 | Amerititle | |
| Vernon Guy | -- | Accommodation |
Source: Public Records
Mortgage History
| Date | Status | Borrower | Loan Amount |
|---|---|---|---|
| Open | Mills Price Michael A | $213,500 | |
| Closed | Mills Price Michael A | $227,500 |
Source: Public Records
Tax History Compared to Growth
Tax History
| Year | Tax Paid | Tax Assessment Tax Assessment Total Assessment is a certain percentage of the fair market value that is determined by local assessors to be the total taxable value of land and additions on the property. | Land | Improvement |
|---|---|---|---|---|
| 2025 | $3,540 | $209,500 | -- | -- |
| 2024 | $3,406 | $203,400 | -- | -- |
| 2023 | $3,157 | $197,480 | $0 | $0 |
| 2022 | $2,945 | $186,150 | $0 | $0 |
| 2021 | $2,950 | $180,730 | $0 | $0 |
| 2020 | $2,799 | $180,730 | $0 | $0 |
| 2019 | $2,721 | $175,470 | $0 | $0 |
| 2018 | $2,644 | $170,360 | $0 | $0 |
| 2017 | $2,566 | $165,400 | $0 | $0 |
| 2016 | $2,448 | $160,590 | $0 | $0 |
| 2015 | $2,380 | $155,920 | $0 | $0 |
| 2014 | $2,286 | $151,380 | $0 | $0 |
Source: Public Records
Map
Nearby Homes
- 2109 NE 11th Place
- 2170 NE 8th St
- 748 NE Vail Ln
- 1848 NE 14th St
- 642 NE Seward Ave
- 1630 NE 13th St
- 1532 NE 9th St
- 1622 NE Parkridge Dr
- 1333 NE Dempsey Dr
- 970 NE Norton Ave Unit Lot 7
- 2667 NE Jones Rd
- 2640 NE 8th St
- 717 NE Olney Ct
- 1401 NE 10th St
- 530 NE Majesty Ln
- 2642 NE Keats Dr
- 1000 NE Butler Market Rd Unit 1
- 3843 NE Petrosa Ave
- 468 NE Olney Ave
- 645 NE Marshall Ave
- 2087 NE 11th Place
- 2087 NE 11th Place
- 1089 NE Hobbs Ct
- 2095 NE 11th Place
- 1083 NE Hobbs Ct
- 970 NE Jones Rd
- 960 NE Jones Rd
- 1077 NE Hobbs Ct
- 1070 NE Jones Rd
- 1090 NE Hobbs Ct
- 1084 NE Hobbs Ct
- 1071 NE Hobbs Ct
- 1078 NE Hobbs Ct
- 1072 NE Hobbs Ct
- 2105 NE 11th Place
- 1076 NE Jones Rd
- 2102 NE 11th Place
- 949 NE Jones Rd
- 2101 NE 11th Place
- 1080 NE Jones Rd