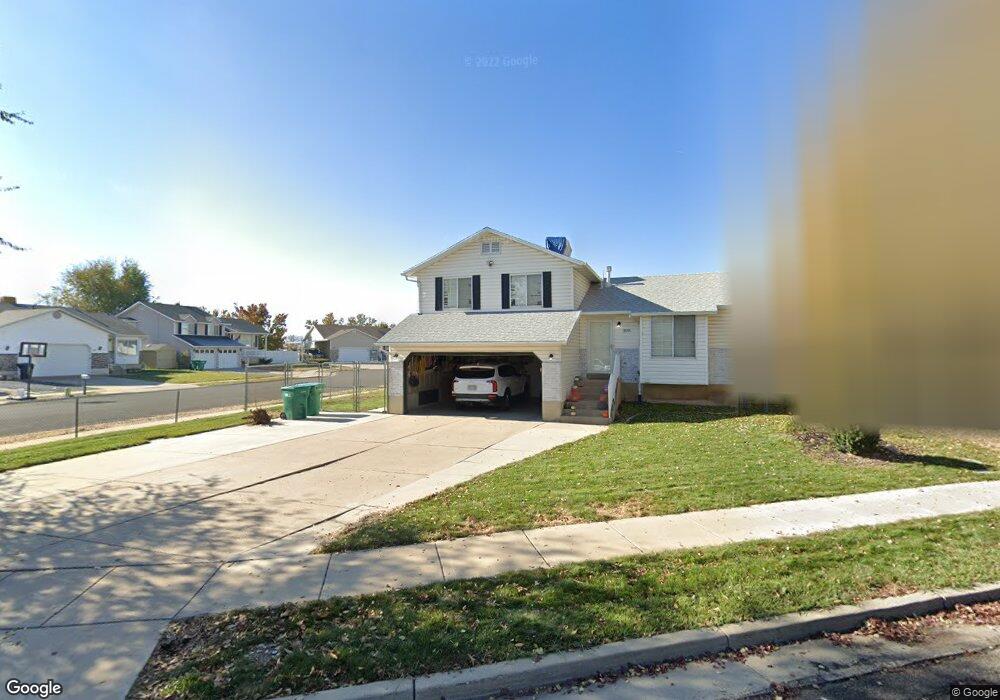
2091 S 50 W Clearfield, UT 84015
Estimated Value: $434,000 - $442,535
4
Beds
2
Baths
1,785
Sq Ft
$246/Sq Ft
Est. Value
About This Home
This home is located at 2091 S 50 W, Clearfield, UT 84015 and is currently estimated at $438,884, approximately $245 per square foot. 2091 S 50 W is a home located in Davis County with nearby schools including Antelope Elementary School, North Davis Junior High School, and Clearfield High School.
Ownership History
Date
Name
Owned For
Owner Type
Purchase Details
Closed on
Mar 28, 2019
Sold by
Henriod Jarred
Bought by
Snook Jazmin and Snook Jerrin
Current Estimated Value
Home Financials for this Owner
Home Financials are based on the most recent Mortgage that was taken out on this home.
Original Mortgage
$250,381
Outstanding Balance
$220,128
Interest Rate
4.4%
Mortgage Type
FHA
Estimated Equity
$218,756
Purchase Details
Closed on
Aug 18, 2016
Sold by
Taylor Rebecca O and Taylor Stuart J
Bought by
Henriod Jarred
Purchase Details
Closed on
Mar 8, 2004
Sold by
Brandley Michael L and Brandley Diana J
Bought by
Taylor Stuart J and Taylor Rebecca O
Home Financials for this Owner
Home Financials are based on the most recent Mortgage that was taken out on this home.
Original Mortgage
$100,000
Interest Rate
5.61%
Mortgage Type
Purchase Money Mortgage
Create a Home Valuation Report for This Property
The Home Valuation Report is an in-depth analysis detailing your home's value as well as a comparison with similar homes in the area
Home Values in the Area
Average Home Value in this Area
Purchase History
| Date | Buyer | Sale Price | Title Company |
|---|---|---|---|
| Snook Jazmin | -- | Backman Title Services | |
| Henriod Jarred | -- | First American Title | |
| Taylor Stuart J | -- | Bonneville Title Company Inc |
Source: Public Records
Mortgage History
| Date | Status | Borrower | Loan Amount |
|---|---|---|---|
| Open | Snook Jazmin | $250,381 | |
| Previous Owner | Taylor Stuart J | $100,000 |
Source: Public Records
Tax History Compared to Growth
Tax History
| Year | Tax Paid | Tax Assessment Tax Assessment Total Assessment is a certain percentage of the fair market value that is determined by local assessors to be the total taxable value of land and additions on the property. | Land | Improvement |
|---|---|---|---|---|
| 2025 | $2,504 | $224,400 | $68,488 | $155,912 |
| 2024 | $2,431 | $219,450 | $65,479 | $153,971 |
| 2023 | $2,221 | $368,000 | $104,807 | $263,193 |
| 2022 | $2,381 | $213,400 | $60,048 | $153,352 |
| 2021 | $2,171 | $294,000 | $63,704 | $230,296 |
| 2020 | $1,889 | $254,000 | $53,549 | $200,451 |
| 2019 | $1,740 | $231,000 | $56,213 | $174,787 |
| 2018 | $1,578 | $204,000 | $49,895 | $154,105 |
| 2016 | $1,372 | $92,730 | $19,922 | $72,808 |
| 2015 | $1,318 | $84,975 | $19,922 | $65,053 |
| 2014 | $1,217 | $79,488 | $19,922 | $59,566 |
| 2013 | -- | $74,440 | $28,374 | $46,066 |
Source: Public Records
Map
Nearby Homes