NOT LISTED FOR SALE

20913 Martinsburg Rd Borden, IN 47106

Estimated Value: $170,000 - $242,373

3 Beds
1 Bath
1,366 Sq Ft
$154/Sq Ft Est. Value

Last Sold May 23, 2018

Last sale price $130,000 $95 Per Sq Ft

Est. 62% increase in value since last sale

Current estimated payment $1,380/month

1 Day on Market

Highlights

  • Scenic Views
  • 1 Car Attached Garage
  • Kitchen Island
  • Deck
  • Eat-In Kitchen
  • 1-Story Property

About This Home

As of May 2018

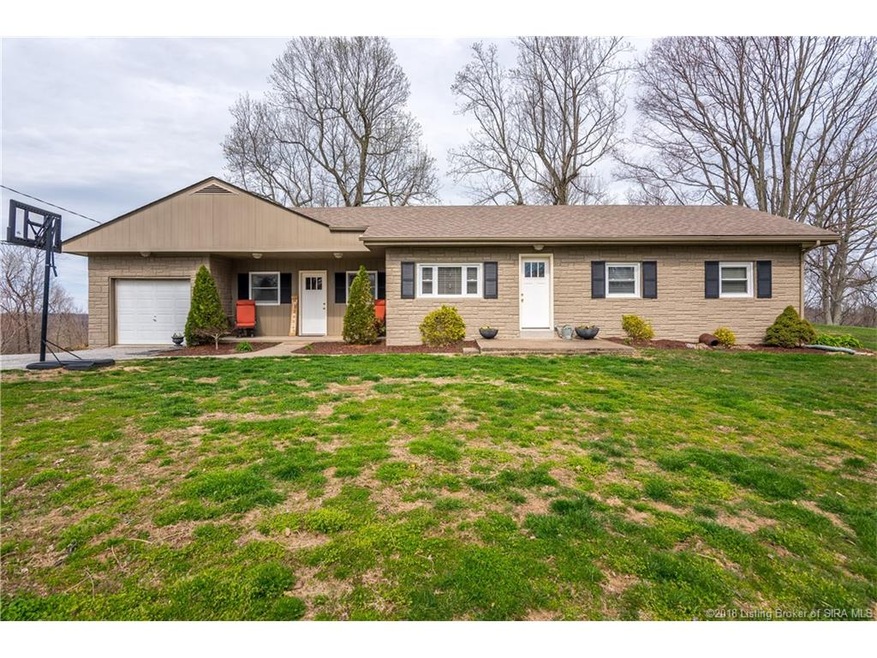
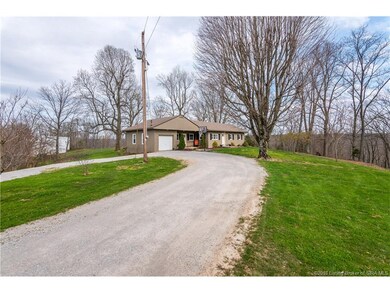
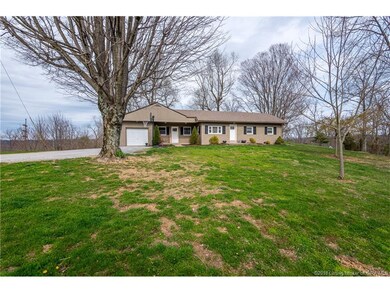
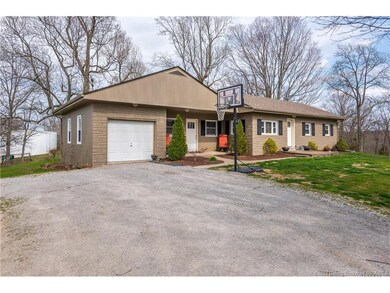
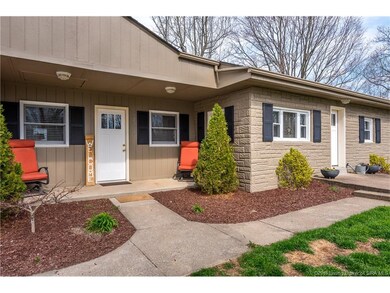
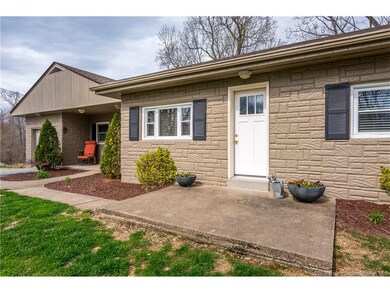
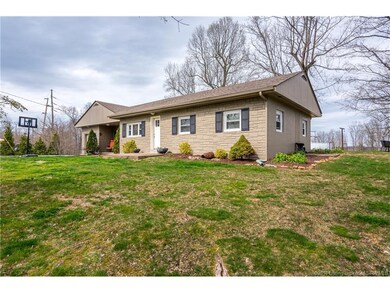
Check out this fantastic home in Borden!! There are 2 parcels for sale in this transaction, the one listed is 3.4ac & the other is 2.3ac that is 5.7ac total!! There are 3 bedrooms & 1 full bathroom! With a large family room and nice living room area, this home would be great for entertaining friends and family! In the kitchen you will definitely notice the large kitchen island! There has been new carpet installed throughout the entire house. When you are standing on the deck you have a PICTURESQUE view of the surrounding area! This home is definitely one you should see! Schedule a showing today. Sq ft & rm sz approx.

Last Agent to Sell the Property

Scott Pearce

Lopp Real Estate Brokers License #RB14045147 Listed on: 04/17/2018

Last Buyer's Agent

Ann Osterhoudt

Lopp Real Estate Brokers License #RB14043305

Home Details

Home Type

  • Single Family

Est. Annual Taxes

  • $702

Year Built

  • Built in 1973

Lot Details

  • 5.7

Parking

  • 1 Car Attached Garage

Property Views

  • Scenic Vista
  • Hills

Home Design

  • Block Foundation
  • Frame Construction
  • Stone Exterior Construction

Interior Spaces

  • 1,366 Sq Ft Home
  • 1-Story Property
  • Blinds
  • Family Room
  • Basement
  • Basement Cellar

Kitchen

  • Eat-In Kitchen
  • Oven or Range
  • Dishwasher
  • Kitchen Island

Bedrooms and Bathrooms

  • 3 Bedrooms
  • 1 Full Bathroom

Utilities

  • Forced Air Heating and Cooling System
  • Electric Water Heater
  • On Site Septic

Additional Features

  • Deck
  • 5.7 Acre Lot

Listing and Financial Details

  • Assessor Parcel Number 101300400075000035

Home Details

Home Type

Single Family

Est. Annual Taxes

$702

Year Built

Built in 1973

Lot Details

0

Parking

1

Listing Details

  • Improvements: 99600
  • Additional Assessor Parcel Numbers: 13-00005-033-0
  • Annual Tax: 702
  • Appointment: Mandatory
  • Construction: Frame On-Site
  • Foundation: Concrete Block
  • Land Assessment: 23600
  • Legal Description: SEC 4-1S-5E 1.7109 AC
  • Lot Dimensions: see lot size
  • Parcel Number: 101300400075000035
  • Property Sub Type: Residential
  • Property Type: Residential/Farm
  • Total: 123200
  • Total Deduction Amnt: 74100
  • Total Finished Square Footage: 1366
  • Type: 1 Story
  • Year Built: 1973
  • Special Features: None

Interior Features

  • Water Heater: Electric
  • Basement Type: Cellar
  • Above Grade Finished Sq Ft: 1366.00
  • Appliances: Dishwasher, Range / Oven
  • Basement: Yes
  • Full Bathrooms: 1
  • Total Bathrooms: 1.00
  • Total Bedrooms: 3
  • Interior Amenities: Blinds, Eat-In Kitchen, Family Room, Kitchen Island
  • Lot Sq Ft: 248292.00
  • Room Count: 7
  • Sewer Type: Septic Onsite
  • Total Sq Ft: 1366
  • Total Rooms: 6

Exterior Features

  • Exterior Features: Deck, Stone

Garage/Parking

  • Garage Type: Attached
  • Garage Spaces: 1
  • Garage Yn: Yes

Utilities

  • Cooling Type: Central Air
  • Fuel Type: Electric
  • Heat Type: Forced Air
  • Water Type: Public Onsite

Schools

  • School District: West Clark Comm.

Lot Info

  • Acres: 5.7000
  • Lot Description: Hill/Knobs View, Scenic View
  • Zoning: Residential

Range of Values:

Collateral Analytics

Collateral Analytics Collateral Analytics AVMs (Automated Valuation Model) employ a number of statistical approaches combined with neighborhood-specific comparable selection guarantees the most up-to-date and precise valuations.

Not Available

Collateral Analytics does not have data for the current month. Please view the chart for historical values.

ICE

ICE Mortgage Technology ICE Mortgage Technology’s AVM (Automated Valuation Model) is a state-of-the-art online residential property valuation tool that provides a quick and accurate estimate of the value of almost any home in the U.S.

Not Available

ICE Mortgage Technology does not have data for the current month. Please view the chart for historical values.

First American

First American First American Data & Analytics’ next-generation AVM combines unrivaled data assets with a blended ensemble of valuation models to produce highly accurate, reliable valuations you can trust.

Not Available

First American does not have data for the current month. Please view the chart for historical values.

Quantarium

Quantarium Quantarium’s valuation service, repeatedly proven the industry’s most accurate and comprehensive, is supercharged with a self-learning and auto-tuning AI engine that continually becomes smarter and more accurate as it processes daily inputs from the industry’s leading RE data lake.

Not Available

Quantarium does not have data for the current month. Please view the chart for historical values.

Average Value
Not Available
List Price
Sold Price
Create a Home Valuation Report for This Property
The Home Valuation Report is an in-depth analysis detailing your home's value as well as a comparison with similar homes in the area

Home Values in the Area

Source: Public Records

Average Home Value in this Area


Source: Public Records

Property History

Date Event Price Change Sq Ft Price
05/23/2018 05/23/18 Sold $130,000 +4.1% $95 / Sq Ft
04/18/2018 04/18/18 Pending -- -- --
04/17/2018 04/17/18 For Sale $124,900 -- $91 / Sq Ft
Source: Southern Indiana REALTORS® Association

Tax History Compared to Growth

Source: Public Records

Tax History

Year Tax Paid Tax Assessment Tax Assessment Total Assessment is a certain percentage of the fair market value that is determined by local assessors to be the total taxable value of land and additions on the property. Land Improvement
2024 $2,680 $217,000 $48,600 $168,400
2023 $2,680 $195,400 $38,600 $156,800
2022 $886 $177,100 $28,600 $148,500
2021 $803 $153,300 $28,600 $124,700
2020 $799 $142,400 $23,600 $118,800
2019 $799 $136,500 $23,600 $112,900
2018 $703 $126,000 $23,600 $102,400
2017 $702 $123,200 $23,600 $99,600
2016 $641 $116,200 $23,600 $92,600
2014 $494 $114,000 $23,600 $90,400
2013 -- $111,100 $23,600 $87,500
Source: Public Records

Agents Affiliated with this Home

  • Section Image
  • Section Image
See All Agents

Map

Source: Southern Indiana REALTORS® Association

MLS Number: 201808169

Southern Indiana REALTORS® Association

APN: 10-13-00-400-075.000-035