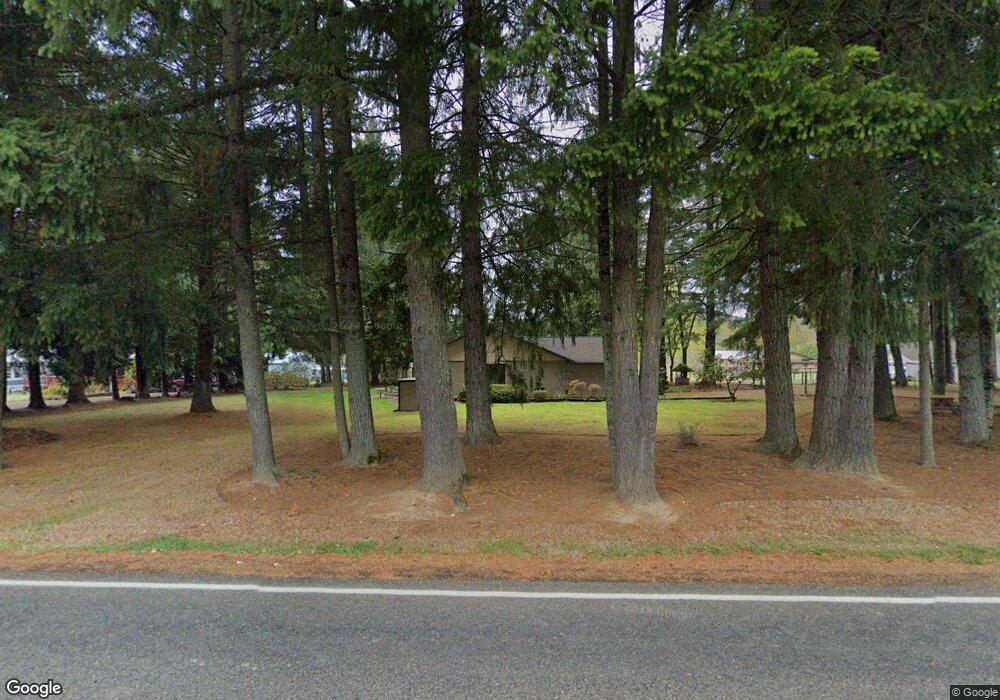
20916 NE 83rd St Vancouver, WA 98682
Estimated Value: $540,000 - $709,000
3
Beds
3
Baths
1,364
Sq Ft
$452/Sq Ft
Est. Value
About This Home
This home is located at 20916 NE 83rd St, Vancouver, WA 98682 and is currently estimated at $615,861, approximately $451 per square foot. 20916 NE 83rd St is a home located in Clark County with nearby schools including Pioneer Elementary School, Frontier Middle School, and Union High School.
Ownership History
Date
Name
Owned For
Owner Type
Purchase Details
Closed on
Sep 12, 2019
Sold by
Buzzini Vickie Lynn and Mcchesney Vicki L
Bought by
Mcchesney Randy E
Current Estimated Value
Home Financials for this Owner
Home Financials are based on the most recent Mortgage that was taken out on this home.
Original Mortgage
$207,000
Outstanding Balance
$181,686
Interest Rate
3.7%
Mortgage Type
New Conventional
Estimated Equity
$434,175
Purchase Details
Closed on
Feb 6, 2015
Sold by
Mcchesney Donald Robert and Mcchesney Ann S
Bought by
Mcchesney Vickie L and Mcchesney Randy E
Home Financials for this Owner
Home Financials are based on the most recent Mortgage that was taken out on this home.
Original Mortgage
$175,000
Interest Rate
3.8%
Mortgage Type
New Conventional
Create a Home Valuation Report for This Property
The Home Valuation Report is an in-depth analysis detailing your home's value as well as a comparison with similar homes in the area
Home Values in the Area
Average Home Value in this Area
Purchase History
| Date | Buyer | Sale Price | Title Company |
|---|---|---|---|
| Mcchesney Randy E | -- | Fidelity Natl Ttl Fishers | |
| Mcchesney Vickie L | $234,719 | Fidelity National Title |
Source: Public Records
Mortgage History
| Date | Status | Borrower | Loan Amount |
|---|---|---|---|
| Open | Mcchesney Randy E | $207,000 | |
| Closed | Mcchesney Vickie L | $175,000 |
Source: Public Records
Tax History Compared to Growth
Tax History
| Year | Tax Paid | Tax Assessment Tax Assessment Total Assessment is a certain percentage of the fair market value that is determined by local assessors to be the total taxable value of land and additions on the property. | Land | Improvement |
|---|---|---|---|---|
| 2025 | $4,865 | $501,362 | $274,819 | $226,543 |
| 2024 | $4,747 | $487,597 | $274,819 | $212,778 |
| 2023 | $4,261 | $499,983 | $270,691 | $229,292 |
| 2022 | $3,863 | $441,762 | $219,736 | $222,026 |
| 2021 | $3,703 | $373,381 | $183,012 | $190,369 |
| 2020 | $3,603 | $336,962 | $176,892 | $160,070 |
| 2019 | $3,109 | $329,502 | $170,771 | $158,731 |
| 2018 | $3,397 | $307,424 | $0 | $0 |
| 2017 | $2,935 | $270,907 | $0 | $0 |
| 2016 | $2,851 | $244,698 | $0 | $0 |
| 2015 | $2,703 | $221,150 | $0 | $0 |
| 2014 | -- | $199,636 | $0 | $0 |
| 2013 | -- | $184,218 | $0 | $0 |
Source: Public Records
Map
Nearby Homes
- 8101 NE 229th Ct
- 10516 NE 209th Ave
- 19703 NE 68th St
- 0 NE 197th Ave
- 18505 NE 78th Way
- 8614 NE 183rd Place
- 18908 NE 65th St
- 18301 NE 78th Cir
- 13509 NE 87th Way Unit Lot 157
- 5610 NE 207th Ave
- 18206 NE 87th Way
- 8702 NE 182nd Place
- 5611 NE 204th Ct
- 18803 NE 65th St
- 10808 NE 192nd Ave
- 20401 NE 116th Cir
- 22505 NE 113th St
- 23505 NE 105th St
- 17613 NE 75th Cir
- 8303 NE 174th Ave
- 21004 NE 83rd St
- 21020 NE 83rd St
- 20922 NE 83rd St
- 8310 NE 212th Ave
- 21103 NE 83rd St
- 8102 NE 211th Ave
- 20718 NE 83rd St
- 20719 NE 83rd St
- 20710 NE 83rd St
- 20604 NE 83rd St
- 21204 NE 83rd St
- 21310 NE 83rd St
- 21318 NE 83rd St
- 8000 NE 211th Ave
- 20508 NE 83rd St
- 7829 NE 211th Ave
- 21406 NE 83rd St
- 8116 NE 217th Ave
- 20509 NE 83rd St
- 0 NE 212th Ave Unit 12420977