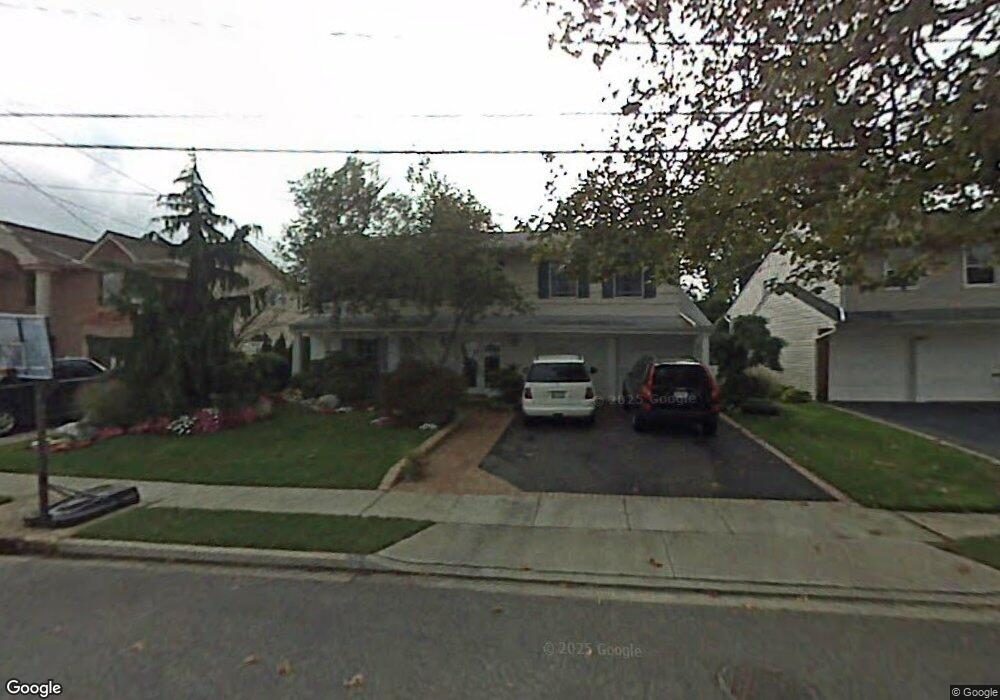
2092 Berkley Ln Merrick, NY 11566
Estimated Value: $1,053,418 - $1,278,000
--
Bed
3
Baths
2,657
Sq Ft
$439/Sq Ft
Est. Value
About This Home
This home is located at 2092 Berkley Ln, Merrick, NY 11566 and is currently estimated at $1,165,709, approximately $438 per square foot. 2092 Berkley Ln is a home located in Nassau County with nearby schools including Burcham Elementary School, Merrick Avenue Middle School, and John F. Kennedy High School.
Ownership History
Date
Name
Owned For
Owner Type
Purchase Details
Closed on
Sep 9, 2025
Sold by
Watson Susan and Freiwirth Susan
Bought by
James T & Susan Watson Irrevocable Tr and Watson
Current Estimated Value
Purchase Details
Closed on
Oct 9, 2008
Sold by
Watson James and Mfreiwirth Susan
Bought by
Watson Susan and Freiwirth Susan
Purchase Details
Closed on
Feb 20, 1998
Sold by
Fisher Roseann and Fisher Elliot
Bought by
Watson James and Freiwirth Susan
Create a Home Valuation Report for This Property
The Home Valuation Report is an in-depth analysis detailing your home's value as well as a comparison with similar homes in the area
Home Values in the Area
Average Home Value in this Area
Purchase History
| Date | Buyer | Sale Price | Title Company |
|---|---|---|---|
| James T & Susan Watson Irrevocable Tr | -- | American Dream Abstract Inc | |
| Watson Susan | -- | Attorney | |
| Watson Susan | -- | Attorney | |
| Watson James | $365,000 | -- |
Source: Public Records
Tax History Compared to Growth
Tax History
| Year | Tax Paid | Tax Assessment Tax Assessment Total Assessment is a certain percentage of the fair market value that is determined by local assessors to be the total taxable value of land and additions on the property. | Land | Improvement |
|---|---|---|---|---|
| 2025 | $21,158 | $697 | $262 | $435 |
| 2024 | $4,756 | $693 | $260 | $433 |
| 2023 | $20,217 | $740 | $278 | $462 |
| 2022 | $20,217 | $735 | $276 | $459 |
| 2021 | $26,820 | $729 | $274 | $455 |
| 2020 | $19,219 | $914 | $679 | $235 |
| 2019 | $17,386 | $979 | $681 | $298 |
| 2018 | $17,490 | $1,045 | $0 | $0 |
| 2017 | $12,772 | $1,110 | $545 | $565 |
| 2016 | $17,522 | $1,480 | $727 | $753 |
| 2015 | $5,873 | $1,480 | $727 | $753 |
| 2014 | $5,873 | $1,480 | $727 | $753 |
| 2013 | $5,557 | $1,480 | $727 | $753 |
Source: Public Records
Map
Nearby Homes