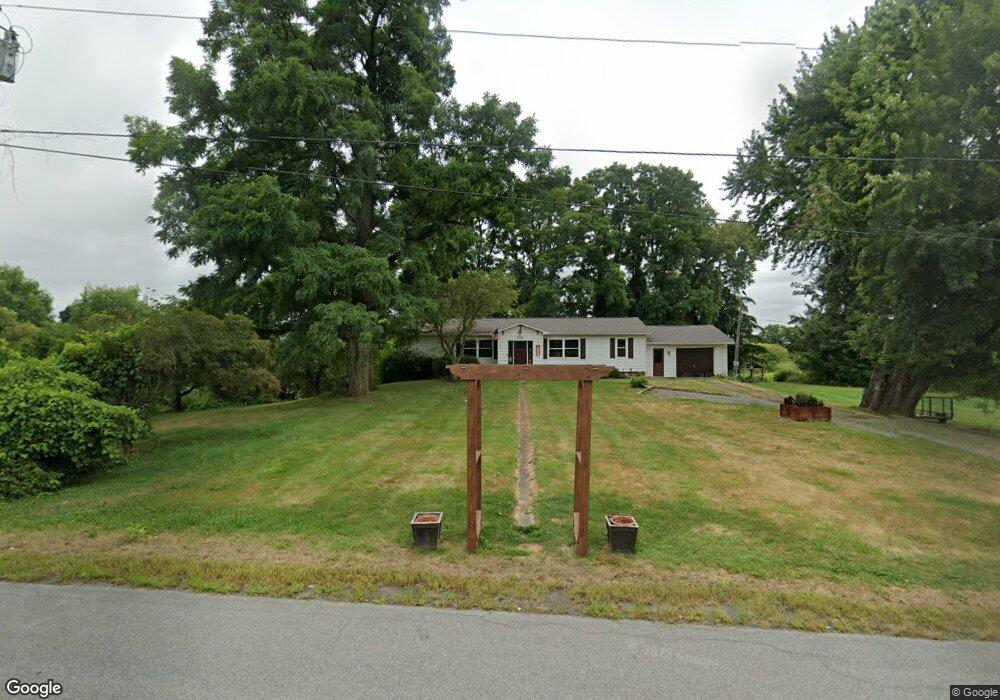
2092 Cox Rd Bloomfield, NY 14469
Estimated Value: $142,000 - $214,000
2
Beds
1
Bath
640
Sq Ft
$279/Sq Ft
Est. Value
About This Home
This home is located at 2092 Cox Rd, Bloomfield, NY 14469 and is currently estimated at $178,729, approximately $279 per square foot. 2092 Cox Rd is a home located in Ontario County with nearby schools including Manor Intermediate School, Lima Elementary School, and Honeoye Falls Lima Middle School.
Ownership History
Date
Name
Owned For
Owner Type
Purchase Details
Closed on
Jul 29, 2024
Sold by
Cox & Bacon Llc
Bought by
Moreau Matthew D
Current Estimated Value
Home Financials for this Owner
Home Financials are based on the most recent Mortgage that was taken out on this home.
Original Mortgage
$136,800
Outstanding Balance
$135,276
Interest Rate
6.95%
Mortgage Type
Purchase Money Mortgage
Estimated Equity
$43,453
Purchase Details
Closed on
Nov 10, 2021
Sold by
Bright New Ventures Inc
Bought by
Bright Kelsey M
Purchase Details
Closed on
Oct 23, 2015
Sold by
Lewis Florence
Bought by
Bright New Ventures Inc
Create a Home Valuation Report for This Property
The Home Valuation Report is an in-depth analysis detailing your home's value as well as a comparison with similar homes in the area
Home Values in the Area
Average Home Value in this Area
Purchase History
| Date | Buyer | Sale Price | Title Company |
|---|---|---|---|
| Moreau Matthew D | $171,000 | None Available | |
| Moreau Matthew D | $171,000 | None Available | |
| Bright Kelsey M | -- | None Available | |
| Bacon & Cox Llc | -- | None Available | |
| Bacon & Cox Llc | -- | None Available | |
| Bright Kelsey M | -- | None Available | |
| Bright Kelsey M | -- | None Available | |
| Bright New Ventures Inc | $50,000 | Frank Mazzarella | |
| Bright New Ventures Inc | $50,000 | Frank Mazzarella |
Source: Public Records
Mortgage History
| Date | Status | Borrower | Loan Amount |
|---|---|---|---|
| Open | Moreau Matthew D | $136,800 | |
| Closed | Moreau Matthew D | $136,800 |
Source: Public Records
Tax History Compared to Growth
Tax History
| Year | Tax Paid | Tax Assessment Tax Assessment Total Assessment is a certain percentage of the fair market value that is determined by local assessors to be the total taxable value of land and additions on the property. | Land | Improvement |
|---|---|---|---|---|
| 2024 | $2,592 | $82,500 | $16,900 | $65,600 |
| 2023 | $2,531 | $82,500 | $16,900 | $65,600 |
| 2022 | $2,351 | $82,500 | $16,900 | $65,600 |
| 2021 | $2,269 | $59,800 | $15,800 | $44,000 |
| 2020 | $2,120 | $59,800 | $15,800 | $44,000 |
| 2019 | $0 | $59,800 | $15,800 | $44,000 |
| 2018 | $1,936 | $55,800 | $15,800 | $40,000 |
| 2017 | $0 | $49,800 | $21,000 | $28,800 |
| 2016 | $1,769 | $47,800 | $21,000 | $26,800 |
| 2015 | -- | $47,800 | $21,000 | $26,800 |
| 2014 | -- | $47,800 | $21,000 | $26,800 |
Source: Public Records
Map
Nearby Homes
- 8812 County Road 14
- VL County Road 14
- 0 County Road 35
- 2275 Olmstead Rd
- 58 Bloomdale Mobile Home Park Unit 58
- 21 Picture Book Park
- 48 Picture Book Park
- 8 Gwyn Ln
- 1939 New York 65
- 1621 Bragg St
- 18 Hunt Club Dr
- 2890 Conn Rd
- 1892 Quaker Meeting House Rd
- 438 Quaker Meeting House Rd
- 7786 State Route 5 and 20
- 1129 Cheese Factory Rd
- 178 Ontario St
- 0 Strong Rd
- 330 Cheese Factory Rd
- 12 Creekside Dr
- 2092 Cox Rd
- 2068 Cox Rd
- 2099 Cox Rd
- 2104 Cox Rd
- 2062 Cox Rd
- 2136 Cox Rd
- 2105 Cox Rd
- 2039 Cox Rd
- 2031 Cox Rd
- 8641 County Road 14
- 8749 County Road 14
- 8685 County Road 14
- 0 County Rd 14 Unit R171510
- 00 Co Road 14
- 0 County Rd 14 Unit R1551515
- 8755 County Road 14
- 0 County Road 14
- 8805 County Road 14
- 8658 County Road 14
- 8633 County Road 14