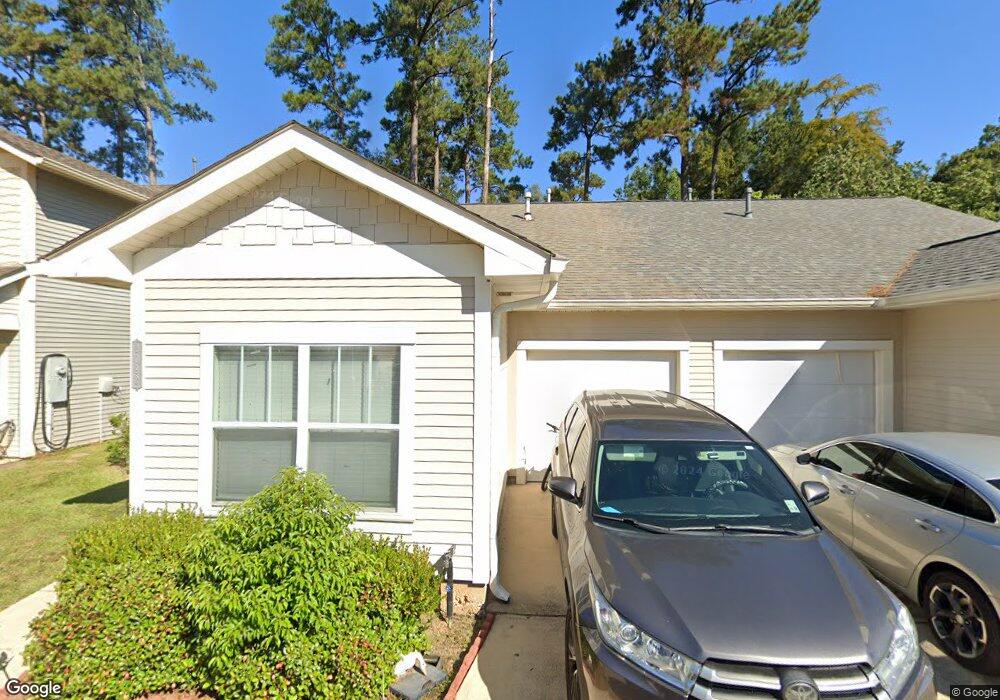
2092 Dundee Loop N Abita Springs, LA 70420
Estimated Value: $185,000 - $200,000
2
Beds
2
Baths
930
Sq Ft
$208/Sq Ft
Est. Value
About This Home
This home is located at 2092 Dundee Loop N, Abita Springs, LA 70420 and is currently estimated at $193,868, approximately $208 per square foot. 2092 Dundee Loop N is a home located in St. Tammany Parish with nearby schools including Abita Springs Elementary School, Abita Springs Middle School, and Fontainebleau Junior High School.
Ownership History
Date
Name
Owned For
Owner Type
Purchase Details
Closed on
Feb 24, 2017
Sold by
Sylvera John Thomas and Sylvera Darrin M
Bought by
Sylvera Tanya L
Current Estimated Value
Home Financials for this Owner
Home Financials are based on the most recent Mortgage that was taken out on this home.
Original Mortgage
$99,000
Outstanding Balance
$82,142
Interest Rate
4.19%
Mortgage Type
New Conventional
Estimated Equity
$111,726
Purchase Details
Closed on
Jan 31, 2017
Sold by
Sylvera Laverne Pascal
Bought by
Sylvera John Thomas and Sylvera Darrin
Home Financials for this Owner
Home Financials are based on the most recent Mortgage that was taken out on this home.
Original Mortgage
$99,000
Outstanding Balance
$82,142
Interest Rate
4.19%
Mortgage Type
New Conventional
Estimated Equity
$111,726
Purchase Details
Closed on
Nov 23, 2011
Sold by
Crews Stacey D
Bought by
Sylvera Laverne
Create a Home Valuation Report for This Property
The Home Valuation Report is an in-depth analysis detailing your home's value as well as a comparison with similar homes in the area
Home Values in the Area
Average Home Value in this Area
Purchase History
| Date | Buyer | Sale Price | Title Company |
|---|---|---|---|
| Sylvera Tanya L | $125,000 | First American Title | |
| Sylvera John Thomas | -- | -- | |
| Sylvera Laverne | $125,000 | Mahony Title & Land Services |
Source: Public Records
Mortgage History
| Date | Status | Borrower | Loan Amount |
|---|---|---|---|
| Open | Sylvera Tanya L | $99,000 |
Source: Public Records
Tax History Compared to Growth
Tax History
| Year | Tax Paid | Tax Assessment Tax Assessment Total Assessment is a certain percentage of the fair market value that is determined by local assessors to be the total taxable value of land and additions on the property. | Land | Improvement |
|---|---|---|---|---|
| 2024 | $1,018 | $13,746 | $3,000 | $10,746 |
| 2023 | $1,018 | $12,339 | $3,000 | $9,339 |
| 2022 | $87,415 | $12,339 | $3,000 | $9,339 |
| 2021 | $864 | $12,339 | $3,000 | $9,339 |
| 2020 | $866 | $12,339 | $3,000 | $9,339 |
| 2019 | $1,524 | $9,396 | $2,484 | $6,912 |
| 2018 | $1,526 | $9,396 | $2,484 | $6,912 |
| 2017 | $1,535 | $9,396 | $2,484 | $6,912 |
| 2016 | $1,539 | $9,396 | $2,484 | $6,912 |
| 2015 | $384 | $9,078 | $2,400 | $6,678 |
| 2014 | $381 | $9,078 | $2,400 | $6,678 |
| 2013 | -- | $11,491 | $2,975 | $8,516 |
Source: Public Records
Map
Nearby Homes
- 3061 Dundee Loop S
- 3005 Dundee Loop S None
- 3005 Dundee Loop S
- 21367 Louisiana 36
- Lots 1A & 12A SQ 8 Saint Charles St
- 0 Saint Charles St
- 71493 Saint Charles St
- 0 St John St Unit 2478893
- 71290 St John St
- 71434 Saint Joseph St
- 22369 Eads St
- 0 Pine St
- Lots 14, 16 Tenth St
- 22128 5th St
- 22120 11th St
- 22052 8th St
- 22033 9th St
- 2096 Dundee Loop N
- 2088 Dundee Loop N
- 2092 Dundee Loop N None
- 3040 Dundee Loop N
- 2100 Dundee Loop N
- 2100 Dundee Loop North None
- 2084 Dundee Loop N
- 2097 Dundee Loop N
- 2097 Dundee Loop North (Lot 58) None
- 2093 Dundee Loop N
- 2089 Dundee Loop North (Lot 60) None
- 2089 E Dundee Loop North None Unit L 60
- 2101 Dundee Loop North (Lot 57) None
- 2076 Dundee Loop North None
- 2080 Dundee Loop N
- 2093 Dundee Loop North (Lot 59) None
- 2089 Dundee Loop N
- 2089 Dundee Loop N Unit L 60
- 2101 Dundee Loop N
- 2085 Dundee Loop N