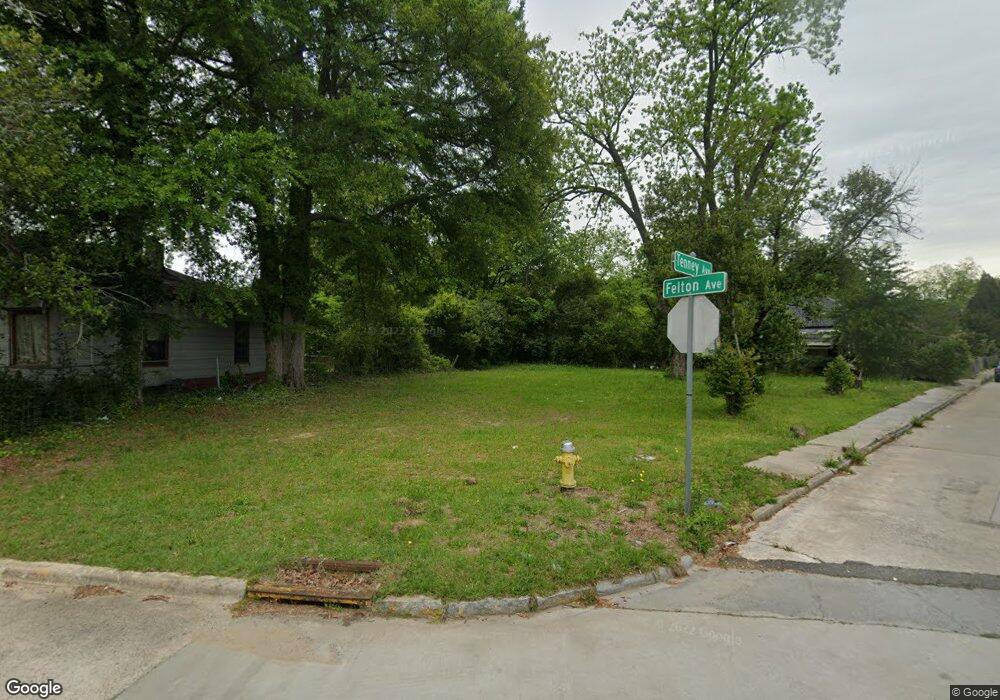
2092 Felton Ave Macon, GA 31201
Tindall Heights Historic District NeighborhoodEstimated Value: $58,000 - $130,000
2
Beds
1
Bath
1,760
Sq Ft
$50/Sq Ft
Est. Value
About This Home
This home is located at 2092 Felton Ave, Macon, GA 31201 and is currently estimated at $88,667, approximately $50 per square foot. 2092 Felton Ave is a home located in Bibb County with nearby schools including Ingram-Pye Elementary School, Central High School, and Cirrus Charter Academy.
Ownership History
Date
Name
Owned For
Owner Type
Purchase Details
Closed on
May 5, 2023
Sold by
Caldwell Anthony
Bought by
Rolling Ronald
Current Estimated Value
Purchase Details
Closed on
May 3, 2023
Sold by
Rajshree 2014 Llc
Bought by
Mare Properties Llc
Purchase Details
Closed on
May 2, 2023
Sold by
State Bank Of Cochran
Bought by
Project Development & Management Llc
Purchase Details
Closed on
Sep 19, 2022
Sold by
Jenuon Calduell Anthony Culdweltd
Bought by
Caldwell Anthony
Purchase Details
Closed on
Jul 21, 2020
Sold by
Macon Bibb County Land Bank Authority
Bought by
Caldwell Anthony and Caldwell Tervon
Purchase Details
Closed on
Mar 6, 2000
Bought by
Morris Fannie E
Create a Home Valuation Report for This Property
The Home Valuation Report is an in-depth analysis detailing your home's value as well as a comparison with similar homes in the area
Home Values in the Area
Average Home Value in this Area
Purchase History
| Date | Buyer | Sale Price | Title Company |
|---|---|---|---|
| Rolling Ronald | $1,000 | None Listed On Document | |
| Lucas Dewong | $154,900 | None Listed On Document | |
| Caldwell Anthony | -- | None Listed On Document | |
| Mare Properties Llc | -- | None Listed On Document | |
| Project Development & Management Llc | -- | None Listed On Document | |
| Caldwell Anthony | $1,000 | -- | |
| Caldwell Anthony | -- | None Available | |
| Morris Fannie E | -- | -- |
Source: Public Records
Tax History Compared to Growth
Tax History
| Year | Tax Paid | Tax Assessment Tax Assessment Total Assessment is a certain percentage of the fair market value that is determined by local assessors to be the total taxable value of land and additions on the property. | Land | Improvement |
|---|---|---|---|---|
| 2025 | $52 | $2,100 | $2,100 | $0 |
| 2024 | $53 | $2,100 | $2,100 | $0 |
| 2023 | $62 | $2,100 | $2,100 | $0 |
| 2022 | $84 | $2,849 | $2,849 | $0 |
| 2021 | $5 | $2,849 | $2,849 | $0 |
| 2020 | $114 | $2,849 | $2,849 | $0 |
| 2019 | $93 | $2,849 | $2,849 | $0 |
| 2018 | $180 | $2,849 | $2,849 | $0 |
| 2017 | $207 | $5,512 | $2,849 | $2,663 |
| 2016 | $206 | $5,956 | $2,849 | $3,107 |
| 2015 | $292 | $5,956 | $2,849 | $3,107 |
| 2014 | $335 | $5,956 | $2,849 | $3,107 |
Source: Public Records
Map
Nearby Homes