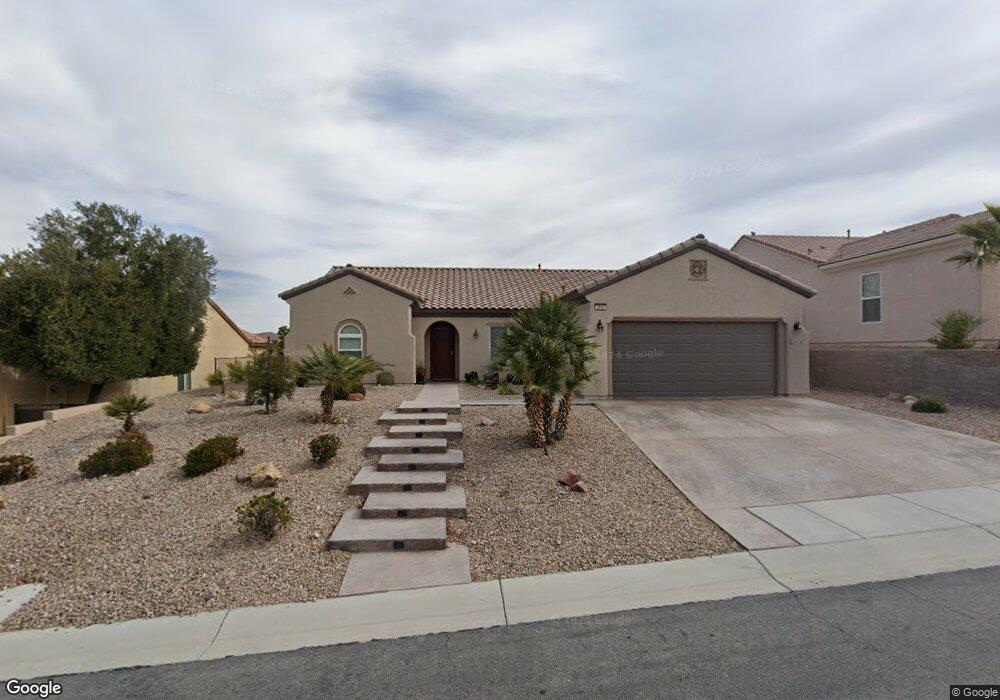
2092 Idaho Falls Dr Unit 27 Henderson, NV 89044
Sun City Anthem NeighborhoodEstimated Value: $598,876 - $767,000
2
Beds
3
Baths
2,096
Sq Ft
$310/Sq Ft
Est. Value
About This Home
This home is located at 2092 Idaho Falls Dr Unit 27, Henderson, NV 89044 and is currently estimated at $650,469, approximately $310 per square foot. 2092 Idaho Falls Dr Unit 27 is a home located in Clark County with nearby schools including Shirley & Bill Wallin Elementary School, Del E. Webb Middle School, and Liberty High School.
Ownership History
Date
Name
Owned For
Owner Type
Purchase Details
Closed on
Aug 31, 2020
Sold by
Ackerman John P and Ackerman Sally
Bought by
Ackerman John P and Ackerman Sally
Current Estimated Value
Purchase Details
Closed on
Sep 25, 2013
Sold by
Ackerman John P and Ackerman Sally
Bought by
The Ackerman Family Trust
Purchase Details
Closed on
Dec 27, 2011
Sold by
Fannie Mae
Bought by
Ackerman John P and Ackerman Sally
Home Financials for this Owner
Home Financials are based on the most recent Mortgage that was taken out on this home.
Original Mortgage
$168,000
Outstanding Balance
$114,955
Interest Rate
3.94%
Mortgage Type
New Conventional
Estimated Equity
$535,514
Purchase Details
Closed on
Sep 19, 2011
Sold by
Thrash James L and Thrash Marsha L
Bought by
Fannie Mae and Federal National Mortgage Association
Purchase Details
Closed on
Apr 15, 2005
Sold by
Del Webb Communities Inc
Bought by
Thrash James L and Thrash Marsha L
Home Financials for this Owner
Home Financials are based on the most recent Mortgage that was taken out on this home.
Original Mortgage
$308,382
Interest Rate
5.84%
Mortgage Type
Fannie Mae Freddie Mac
Create a Home Valuation Report for This Property
The Home Valuation Report is an in-depth analysis detailing your home's value as well as a comparison with similar homes in the area
Home Values in the Area
Average Home Value in this Area
Purchase History
| Date | Buyer | Sale Price | Title Company |
|---|---|---|---|
| Ackerman John P | -- | None Available | |
| The Ackerman Family Trust | -- | None Available | |
| Ackerman John P | $268,000 | Stewart Title Of Nevada | |
| Fannie Mae | $310,106 | Accommodation | |
| Thrash James L | $386,478 | Lawyers Title Of Nevada |
Source: Public Records
Mortgage History
| Date | Status | Borrower | Loan Amount |
|---|---|---|---|
| Open | Ackerman John P | $168,000 | |
| Previous Owner | Thrash James L | $308,382 |
Source: Public Records
Tax History Compared to Growth
Tax History
| Year | Tax Paid | Tax Assessment Tax Assessment Total Assessment is a certain percentage of the fair market value that is determined by local assessors to be the total taxable value of land and additions on the property. | Land | Improvement |
|---|---|---|---|---|
| 2025 | $3,200 | $145,582 | $50,750 | $94,832 |
| 2024 | $3,107 | $145,582 | $50,750 | $94,832 |
| 2023 | $3,107 | $136,635 | $47,250 | $89,385 |
| 2022 | $3,307 | $120,765 | $39,200 | $81,565 |
| 2021 | $3,063 | $111,382 | $33,950 | $77,432 |
| 2020 | $2,841 | $110,205 | $33,600 | $76,605 |
| 2019 | $2,758 | $106,954 | $31,500 | $75,454 |
| 2018 | $2,678 | $102,284 | $29,750 | $72,534 |
| 2017 | $2,940 | $100,490 | $28,000 | $72,490 |
| 2016 | $2,536 | $98,050 | $22,750 | $75,300 |
| 2015 | $2,531 | $89,822 | $15,750 | $74,072 |
| 2014 | $2,457 | $83,876 | $12,250 | $71,626 |
Source: Public Records
Map
Nearby Homes
- 2101 Sawtooth Mountain Dr
- 2115 Burtonsville Dr
- 2119 Burtonsville Dr Unit 27
- 2114 Twin Falls Dr
- 2091 Waterton Rivers Dr
- 2120 Twin Falls Dr Unit 23
- 2318 Shorewood Hills Ave
- 2359 Blooming Valley Ct
- 2218 Sandstone Cliffs Dr
- 2117 Bliss Corner St
- 2131 Waterton Rivers Dr
- 2052 Powder Springs St
- 2154 Idaho Falls Dr
- 2156 Twin Falls Dr
- 2117 Shadow Canyon Dr
- 2175 Sandstone Cliffs Dr
- 2163 Waterton Rivers Dr
- 2225 Blackburn Hills Ave
- 2175 Waterton Rivers Dr
- 2151 Shadow Canyon Dr
- 2088 Idaho Falls Dr
- 2096 Idaho Falls Dr
- 2095 Savannah River St
- 2091 Savannah River St
- 2099 Savannah River St
- 2093 Idaho Falls Dr
- 2097 Idaho Falls Dr
- 2100 Idaho Falls Dr
- 2087 Savannah River St
- 2084 Idaho Falls Dr
- 2089 Idaho Falls Dr
- 2101 Idaho Falls Dr
- 2101 Idaho Falls Dr Unit na
- 2103 Savannah River St
- 2083 Savannah River St
- 2085 Idaho Falls Dr
- 2105 Idaho Falls Dr
- 2104 Idaho Falls Dr
- 2080 Idaho Falls Dr
- 2107 Savannah River St