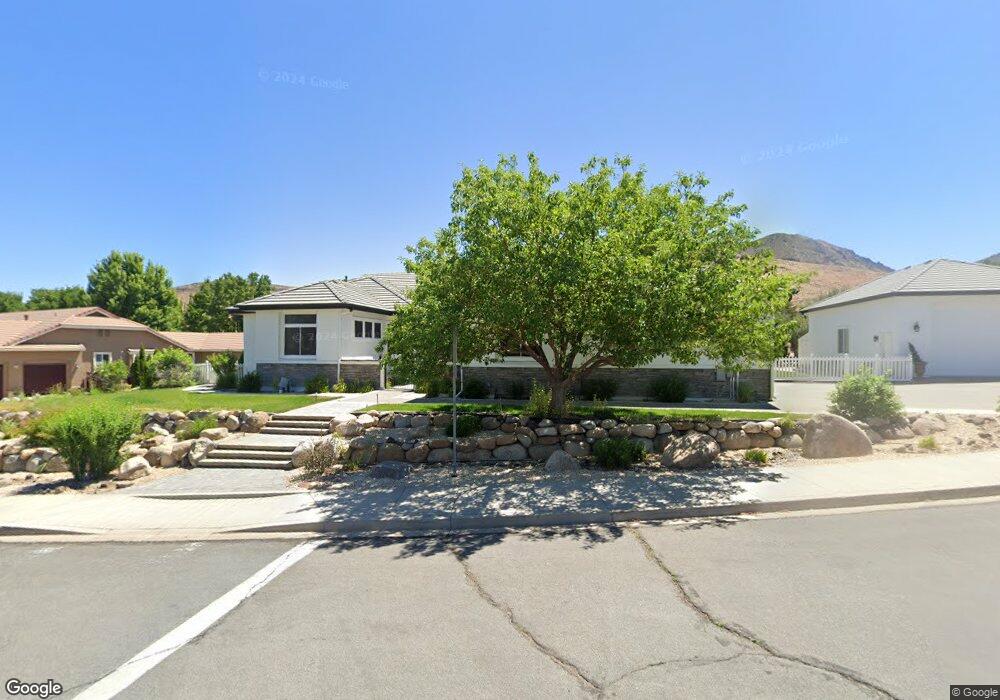
2092 Tamarisk Dr Reno, NV 89502
Hidden Valley NeighborhoodEstimated Value: $930,421 - $1,042,000
5
Beds
3
Baths
3,187
Sq Ft
$312/Sq Ft
Est. Value
About This Home
This home is located at 2092 Tamarisk Dr, Reno, NV 89502 and is currently estimated at $993,855, approximately $311 per square foot. 2092 Tamarisk Dr is a home located in Washoe County with nearby schools including Hidden Valley Elementary School, Edward L Pine Middle School, and Earl Wooster High School.
Ownership History
Date
Name
Owned For
Owner Type
Purchase Details
Closed on
Dec 18, 2020
Sold by
Hobbs Gary A
Bought by
Hobbs Scott A and Hobbs Harmony L
Current Estimated Value
Home Financials for this Owner
Home Financials are based on the most recent Mortgage that was taken out on this home.
Original Mortgage
$160,000
Outstanding Balance
$142,052
Interest Rate
2.8%
Mortgage Type
New Conventional
Estimated Equity
$851,803
Purchase Details
Closed on
May 3, 2001
Sold by
Hobbs Gary A and Hobbs Margaret P
Bought by
Hobbs Gary A and Hobbs Margaret P
Purchase Details
Closed on
Apr 26, 1999
Sold by
Hidden Meadows Ltd
Bought by
Hobbs Gary A and Hobbs Margaret P
Home Financials for this Owner
Home Financials are based on the most recent Mortgage that was taken out on this home.
Original Mortgage
$150,000
Interest Rate
6.98%
Create a Home Valuation Report for This Property
The Home Valuation Report is an in-depth analysis detailing your home's value as well as a comparison with similar homes in the area
Home Values in the Area
Average Home Value in this Area
Purchase History
| Date | Buyer | Sale Price | Title Company |
|---|---|---|---|
| Hobbs Scott A | -- | First Centennial Reno | |
| Hobbs Gary A | -- | First Centennial Reno | |
| Hobbs Gary A | -- | -- | |
| Hobbs Gary A | $350,000 | First Centennial Title Co |
Source: Public Records
Mortgage History
| Date | Status | Borrower | Loan Amount |
|---|---|---|---|
| Open | Hobbs Scott A | $160,000 | |
| Closed | Hobbs Gary A | $150,000 |
Source: Public Records
Tax History
| Year | Tax Paid | Tax Assessment Tax Assessment Total Assessment is a certain percentage of the fair market value that is determined by local assessors to be the total taxable value of land and additions on the property. | Land | Improvement |
|---|---|---|---|---|
| 2026 | $3,812 | $217,112 | $61,250 | $155,862 |
| 2024 | $4,952 | $217,387 | $57,295 | $160,092 |
| 2023 | $4,803 | $208,548 | $57,295 | $151,253 |
| 2022 | $4,666 | $170,588 | $44,870 | $125,718 |
| 2021 | $4,530 | $161,896 | $36,295 | $125,601 |
| 2020 | $4,399 | $162,385 | $36,295 | $126,090 |
| 2019 | $4,268 | $157,186 | $35,070 | $122,116 |
| 2018 | $4,146 | $143,721 | $24,115 | $119,606 |
| 2017 | $4,024 | $142,089 | $22,190 | $119,899 |
| 2016 | $3,921 | $144,703 | $22,330 | $122,373 |
| 2015 | $3,840 | $139,925 | $20,440 | $119,485 |
| 2014 | $3,726 | $128,440 | $18,620 | $109,820 |
| 2013 | -- | $111,260 | $14,980 | $96,280 |
Source: Public Records
Map
Nearby Homes
- 1860 Hidden Meadows Dr
- 2835 Parkway Dr
- 3620 E Hidden Valley Dr
- 3370 Shawnee Cir
- 3533 E Hidden Valley Dr
- 2790 Fairwood Dr
- 5585 E Hidden Valley Dr
- 5705 Blue Hills Dr
- 5700 E Hidden Valley Dr
- 4841 W Hidden Valley Dr
- 5279 Mira Loma Dr
- 3059 Creekwood Dr
- 3069 Creekwood Dr
- 5860 E Hidden Valley Dr
- 5984 Hidden Highlands Dr
- 6120 E Hidden Valley Dr
- 2719 Chavez Dr
- 2771 Santa Ana Dr
- 4330 Valdez Way
- 2945 Santa Ana Dr
- 2088 Tamarisk Dr
- 6010 Meadow Edge Dr
- 6011 Meadow Edge Dr
- 2084 Tamarisk Dr
- 6009 Meadow Edge Dr
- 6008 Meadow Edge Dr
- 2097 Tamarisk Dr
- 7150 History Dr
- 300 Desert Meadow Ct
- 292 Nicholaus Dr
- 290 Nicholaus Dr
- 7160 History Dr
- 310 Desert Meadow Ct Unit 2
- 6007 Meadow Edge Dr
- 2078 Tamarisk Dr
- 6006 Meadow Edge Dr
- 7165 Pembroke Dr
- 305 Desert Meadow Ct
- 7170 History Dr
- 7155 Pembroke Dr
Your Personal Tour Guide
Ask me questions while you tour the home.