Estimated Value: $329,000 - $380,000
2
Beds
1
Bath
1,650
Sq Ft
$214/Sq Ft
Est. Value
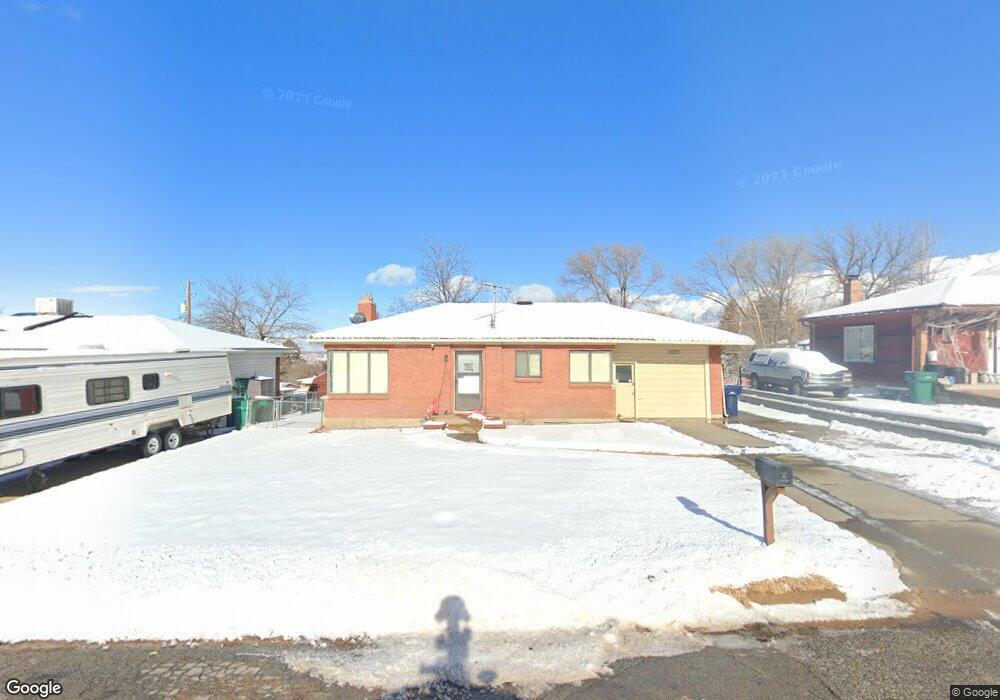
About This Home
This home is located at 2092 W 3875 S, Roy, UT 84067 and is currently estimated at $353,459, approximately $214 per square foot. 2092 W 3875 S is a home located in Weber County with nearby schools including North Park School, Sand Ridge Junior High School, and Roy High School.
Ownership History
Date
Name
Owned For
Owner Type
Purchase Details
Closed on
May 7, 2020
Sold by
Coy Kambri and Coy Austin K
Bought by
Coy Kambri and Coy Austin K
Current Estimated Value
Home Financials for this Owner
Home Financials are based on the most recent Mortgage that was taken out on this home.
Original Mortgage
$163,800
Outstanding Balance
$145,690
Interest Rate
3.5%
Mortgage Type
New Conventional
Estimated Equity
$207,769
Purchase Details
Closed on
Aug 23, 2017
Sold by
Hansen Camille J
Bought by
Spinden Kambri and Coy Austin K
Home Financials for this Owner
Home Financials are based on the most recent Mortgage that was taken out on this home.
Original Mortgage
$156,120
Interest Rate
4.25%
Mortgage Type
FHA
Purchase Details
Closed on
Jan 21, 2014
Sold by
Petracek Eloise Evelyn
Bought by
Hansen Camille J
Home Financials for this Owner
Home Financials are based on the most recent Mortgage that was taken out on this home.
Original Mortgage
$6,380
Interest Rate
4.4%
Mortgage Type
Stand Alone Second
Create a Home Valuation Report for This Property
The Home Valuation Report is an in-depth analysis detailing your home's value as well as a comparison with similar homes in the area
Home Values in the Area
Average Home Value in this Area
Purchase History
| Date | Buyer | Sale Price | Title Company |
|---|---|---|---|
| Coy Kambri | -- | Pinnacle Title | |
| Spinden Kambri | -- | Lincoln Title Ins Agency | |
| Hansen Camille J | -- | Us Title Insurance Agency |
Source: Public Records
Mortgage History
| Date | Status | Borrower | Loan Amount |
|---|---|---|---|
| Open | Coy Kambri | $163,800 | |
| Closed | Spinden Kambri | $156,120 | |
| Previous Owner | Hansen Camille J | $6,380 |
Source: Public Records
Tax History Compared to Growth
Tax History
| Year | Tax Paid | Tax Assessment Tax Assessment Total Assessment is a certain percentage of the fair market value that is determined by local assessors to be the total taxable value of land and additions on the property. | Land | Improvement |
|---|---|---|---|---|
| 2025 | $2,108 | $325,070 | $113,269 | $211,801 |
| 2024 | $2,060 | $175,999 | $62,350 | $113,649 |
| 2023 | $2,026 | $173,800 | $59,993 | $113,807 |
| 2022 | $2,104 | $187,000 | $51,858 | $135,142 |
| 2021 | $1,828 | $268,000 | $64,334 | $203,666 |
| 2020 | $1,544 | $205,000 | $64,334 | $140,666 |
| 2019 | $1,477 | $184,000 | $39,525 | $144,475 |
| 2018 | $1,285 | $148,000 | $34,435 | $113,565 |
| 2017 | $1,266 | $137,000 | $32,480 | $104,520 |
| 2016 | $1,182 | $68,244 | $13,213 | $55,031 |
| 2015 | $1,064 | $62,186 | $16,496 | $45,690 |
| 2014 | $1,034 | $59,517 | $16,496 | $43,021 |
Source: Public Records
Map
Nearby Homes
- 2096 W 3950 S
- 2070 W 4000 S
- 2050 W 4000 S
- 3965 S 2225 W
- 3923 S 1975 W Unit 15
- 1959 3985 St S Unit 2
- 4073 S 2175 W
- 1910 W 3920 S
- 3854 S 1925 W
- 4110 S 2275 W
- 3860 Midland Dr Unit C10
- 3860 Midland Dr Unit A18
- 3860 Midland Dr Unit B32
- 4205 S 2075 W
- 4220 S 2075 W
- 4164 S 2400 W
- 3800 S 1900 W Unit 28
- 3800 S 1900 W Unit 64
- 3800 S 1900 W Unit 66
- 3800 S 1900 W Unit 89