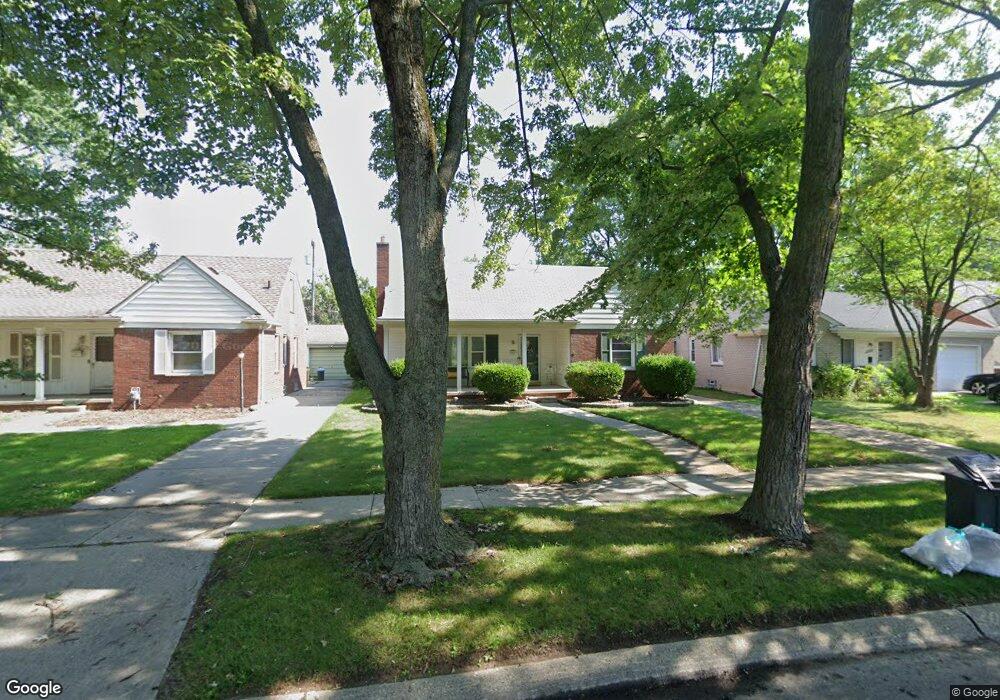
20927 Norwood Dr Harper Woods, MI 48225
Estimated Value: $209,000 - $262,000
4
Beds
1
Bath
1,402
Sq Ft
$169/Sq Ft
Est. Value
About This Home
This home is located at 20927 Norwood Dr, Harper Woods, MI 48225 and is currently estimated at $237,565, approximately $169 per square foot. 20927 Norwood Dr is a home located in Wayne County with nearby schools including Parcells Middle School, Grosse Pointe North High School, and University Liggett School.
Ownership History
Date
Name
Owned For
Owner Type
Purchase Details
Closed on
Nov 16, 2021
Sold by
Warner Lashell R and Warner Raymond E
Bought by
Warner Lashell R
Current Estimated Value
Home Financials for this Owner
Home Financials are based on the most recent Mortgage that was taken out on this home.
Original Mortgage
$120,000
Outstanding Balance
$102,349
Interest Rate
3.09%
Mortgage Type
New Conventional
Estimated Equity
$135,216
Purchase Details
Closed on
Apr 18, 2017
Sold by
Gibson Lashell R and Warner Lashell R
Bought by
Warner Lashell R
Home Financials for this Owner
Home Financials are based on the most recent Mortgage that was taken out on this home.
Original Mortgage
$113,600
Interest Rate
4.3%
Mortgage Type
New Conventional
Purchase Details
Closed on
Apr 10, 2008
Sold by
Gmac Global Relocation Services Llc
Bought by
Gibson Lashell R
Purchase Details
Closed on
May 31, 2001
Sold by
Ellis Charlotte T
Bought by
Karbowski Robert C
Create a Home Valuation Report for This Property
The Home Valuation Report is an in-depth analysis detailing your home's value as well as a comparison with similar homes in the area
Home Values in the Area
Average Home Value in this Area
Purchase History
| Date | Buyer | Sale Price | Title Company |
|---|---|---|---|
| Warner Lashell R | -- | None Available | |
| Warner Lashell R | -- | Liberty Title | |
| Gibson Lashell R | $131,000 | Metropolitan | |
| Gmac Global Relocation Services Llc | $131,000 | Metropolitan | |
| Karbowski Robert C | $155,000 | -- |
Source: Public Records
Mortgage History
| Date | Status | Borrower | Loan Amount |
|---|---|---|---|
| Open | Warner Lashell R | $120,000 | |
| Closed | Warner Lashell R | $113,600 |
Source: Public Records
Tax History Compared to Growth
Tax History
| Year | Tax Paid | Tax Assessment Tax Assessment Total Assessment is a certain percentage of the fair market value that is determined by local assessors to be the total taxable value of land and additions on the property. | Land | Improvement |
|---|---|---|---|---|
| 2025 | $1,125 | $104,200 | $0 | $0 |
| 2024 | $1,125 | $97,600 | $0 | $0 |
| 2023 | $1,074 | $89,400 | $0 | $0 |
| 2022 | $3,515 | $74,600 | $0 | $0 |
| 2021 | $3,288 | $71,600 | $0 | $0 |
| 2019 | $3,317 | $52,700 | $0 | $0 |
| 2018 | $783 | $42,200 | $0 | $0 |
| 2017 | $4,415 | $42,200 | $0 | $0 |
| 2016 | $3,087 | $40,900 | $0 | $0 |
| 2015 | $3,561 | $36,500 | $0 | $0 |
| 2013 | $3,440 | $34,400 | $0 | $0 |
| 2012 | $493 | $35,100 | $9,200 | $25,900 |
Source: Public Records
Map
Nearby Homes
- 20950 Norwood Dr
- 20886 Hunt Club Dr
- 2048 Hunt Club Dr
- 20884 Woodmont St
- 20914 Woodmont St
- 20602 Kenmore Ave
- 20611 Damman St
- 20923 Wildwood Dr Unit 226
- 20852 Wildwood Dr Unit 109
- 1953 Hunt Club Dr
- 20870 Wildwood Dr Unit 221
- 20506 Lochmoor St
- 19804 Harper Ave Unit 202
- 20672 Fleetwood Dr
- 20696 Huntington Ave
- 20616 Lancaster St
- 20703 Fleetwood Dr
- 20498 Country Club Dr
- 20522 Woodmont St
- 20490 Country Club Dr
- 20935 Norwood Dr
- 20943 Norwood Dr
- 20903 Norwood Dr
- 20951 Norwood Dr
- 20926 Hunt Club Dr
- 20918 Hunt Club Dr
- 20934 Hunt Club Dr
- 20910 Hunt Club Dr
- 20942 Hunt Club Dr
- 20895 Norwood Dr
- 20932 Norwood Dr
- 20902 Hunt Club Dr
- 20922 Norwood Dr
- 20950 Hunt Club Dr
- 20942 Norwood Dr
- 20910 Norwood Dr
- 20887 Norwood Dr
- 20894 Hunt Club Dr
- 21102 Hunt Club Dr
- 20900 Norwood Dr