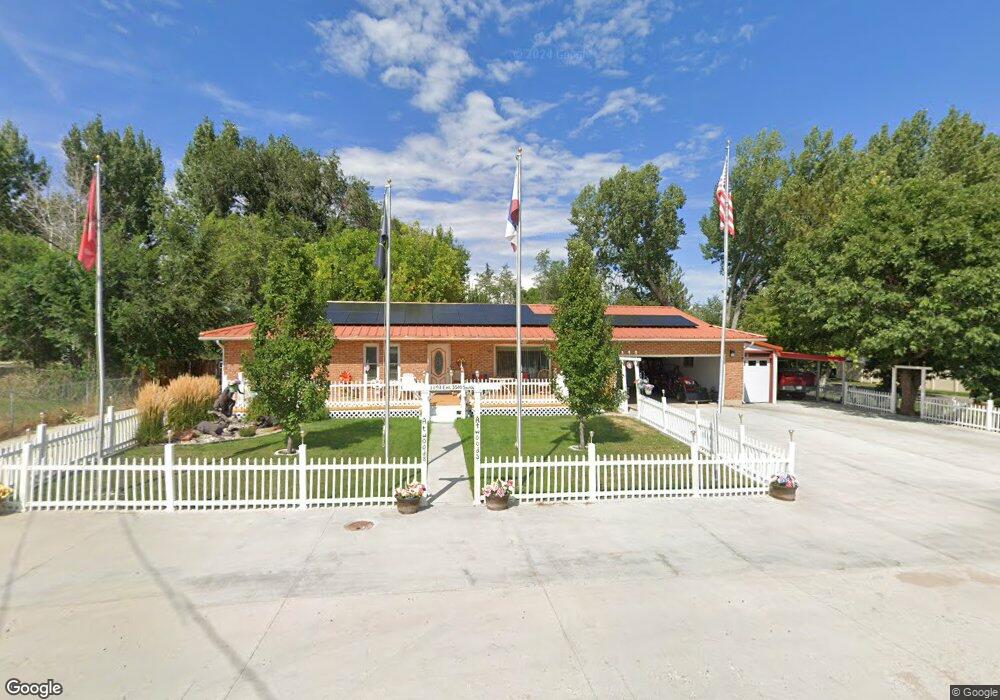
2093 E 3500 S Vernal, UT 84078
Estimated Value: $329,000 - $400,803
4
Beds
3
Baths
1,736
Sq Ft
$211/Sq Ft
Est. Value
About This Home
This home is located at 2093 E 3500 S, Vernal, UT 84078 and is currently estimated at $366,701, approximately $211 per square foot. 2093 E 3500 S is a home located in Uintah County with nearby schools including Davis School, Vernal Middle School, and Uintah Middle School.
Ownership History
Date
Name
Owned For
Owner Type
Purchase Details
Closed on
Sep 29, 2017
Sold by
Randall Victoria
Bought by
Atwood Blaine and Atwood Edith E
Current Estimated Value
Purchase Details
Closed on
May 17, 2010
Sold by
Usbc Bank Usa Na
Bought by
Randall Victoria
Home Financials for this Owner
Home Financials are based on the most recent Mortgage that was taken out on this home.
Original Mortgage
$150,000
Interest Rate
4.82%
Mortgage Type
USDA
Purchase Details
Closed on
Feb 26, 2010
Sold by
Davis Alfred T and Davis Jackie J
Bought by
Hsbc Bank Usa Na
Purchase Details
Closed on
Jan 3, 2007
Sold by
Boren Trudy L and Boren Cody J
Bought by
Davis Alfred T and Davis Jackie J
Home Financials for this Owner
Home Financials are based on the most recent Mortgage that was taken out on this home.
Original Mortgage
$230,160
Interest Rate
6.95%
Mortgage Type
Adjustable Rate Mortgage/ARM
Create a Home Valuation Report for This Property
The Home Valuation Report is an in-depth analysis detailing your home's value as well as a comparison with similar homes in the area
Purchase History
| Date | Buyer | Sale Price | Title Company |
|---|---|---|---|
| Atwood Blaine | -- | Advanced Title | |
| Randall Victoria | -- | -- | |
| Hsbc Bank Usa Na | -- | -- | |
| Davis Alfred T | -- | -- |
Source: Public Records
Mortgage History
| Date | Status | Borrower | Loan Amount |
|---|---|---|---|
| Previous Owner | Randall Victoria | $150,000 | |
| Previous Owner | Davis Alfred T | $230,160 |
Source: Public Records
Tax History
| Year | Tax Paid | Tax Assessment Tax Assessment Total Assessment is a certain percentage of the fair market value that is determined by local assessors to be the total taxable value of land and additions on the property. | Land | Improvement |
|---|---|---|---|---|
| 2024 | $1,532 | $176,923 | $19,094 | $157,829 |
| 2023 | $1,487 | $155,153 | $19,094 | $136,059 |
| 2022 | $1,320 | $127,941 | $19,094 | $108,847 |
| 2021 | $1,380 | $60,390 | $10,502 | $49,888 |
| 2020 | $1,270 | $103,768 | $19,250 | $84,518 |
| 2019 | $1,217 | $98,239 | $19,250 | $78,989 |
| 2018 | $1,169 | $94,477 | $19,250 | $75,227 |
| 2017 | $11 | $94,477 | $19,250 | $75,227 |
| 2016 | $1,188 | $105,421 | $19,250 | $86,171 |
| 2015 | $1,139 | $109,768 | $19,250 | $90,518 |
| 2014 | $1,082 | $105,458 | $19,250 | $86,208 |
| 2013 | $1,105 | $105,458 | $19,250 | $86,208 |
Source: Public Records
Map
Nearby Homes
- 2020 E 3500 S
- 2308 E Highway 40
- 1852 E 3500 S
- 3310 S 2500 E
- 1676 E 4000 S
- 2636 E 3950 S
- 2658 E 3950 S
- 4361 S 2280 E
- 1801 E 4500 S
- 1676 E 2500 S
- 1500 E 2500 S
- 3311 E 3500 S Unit 3
- 3331 E 3500 S Unit 4
- 4726 S 2500 E
- 709 E 2970 S
- 2685 S 500 E
- 3541 U S Highway 40
- 4977 S 2625 E
- 2102 E 1820 S
- 2200 E 1820 S
Your Personal Tour Guide
Ask me questions while you tour the home.