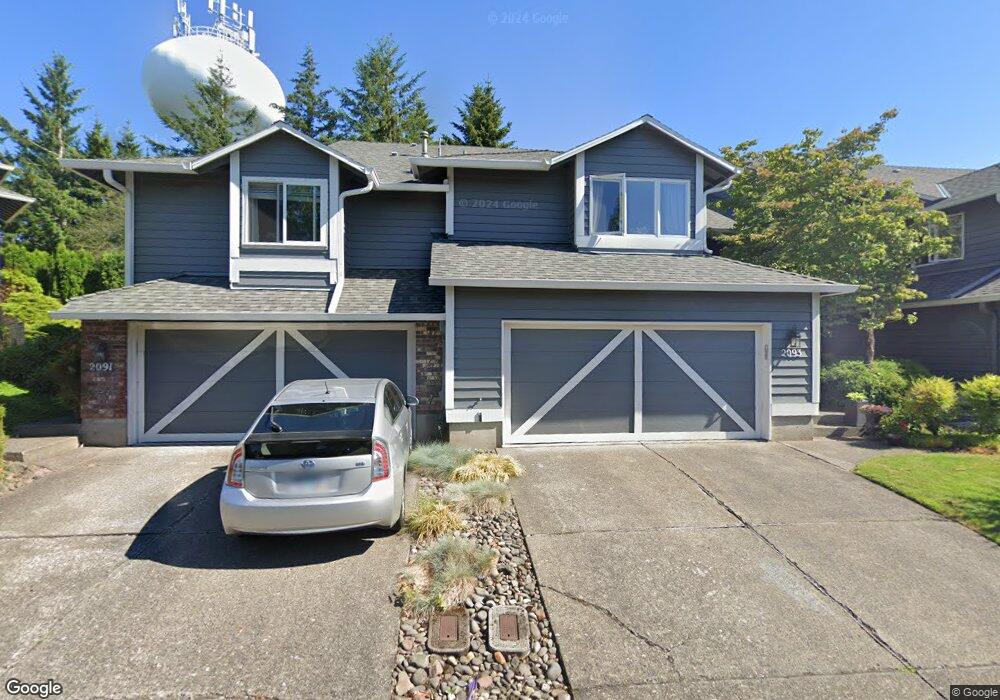
2093 Sunray Cir West Linn, OR 97068
Hidden Springs NeighborhoodEstimated Value: $446,000 - $661,000
2
Beds
3
Baths
1,954
Sq Ft
$270/Sq Ft
Est. Value
About This Home
This home is located at 2093 Sunray Cir, West Linn, OR 97068 and is currently estimated at $526,928, approximately $269 per square foot. 2093 Sunray Cir is a home located in Clackamas County with nearby schools including Trillium Creek Primary School, Rosemont Ridge Middle School, and West Linn High School.
Ownership History
Date
Name
Owned For
Owner Type
Purchase Details
Closed on
May 9, 2014
Sold by
Blackcomb Construction Inc
Bought by
Reyer Mark A and Reyer Barbara E
Current Estimated Value
Purchase Details
Closed on
Nov 22, 2013
Sold by
Parcell Tamara
Bought by
Blackcomb Construction Inc
Purchase Details
Closed on
Mar 9, 2006
Sold by
Aspen Do Llc
Bought by
Parcell Tamara
Home Financials for this Owner
Home Financials are based on the most recent Mortgage that was taken out on this home.
Original Mortgage
$35,109
Interest Rate
5.66%
Mortgage Type
Stand Alone Second
Purchase Details
Closed on
Sep 21, 1998
Sold by
Whitney Tamara and Parcell Tamara
Bought by
Parcell Tamara
Home Financials for this Owner
Home Financials are based on the most recent Mortgage that was taken out on this home.
Original Mortgage
$166,500
Interest Rate
6.88%
Create a Home Valuation Report for This Property
The Home Valuation Report is an in-depth analysis detailing your home's value as well as a comparison with similar homes in the area
Home Values in the Area
Average Home Value in this Area
Purchase History
| Date | Buyer | Sale Price | Title Company |
|---|---|---|---|
| Reyer Mark A | $284,900 | None Available | |
| Blackcomb Construction Inc | $199,900 | Fidelity Natl Title Co Of Or | |
| Parcell Tamara | $207,545 | Fidelity Natl Title Co Of Or | |
| Parcell Tamara | -- | Fidelity National Title Co |
Source: Public Records
Mortgage History
| Date | Status | Borrower | Loan Amount |
|---|---|---|---|
| Previous Owner | Parcell Tamara | $35,109 | |
| Previous Owner | Parcell Tamara | $166,036 | |
| Previous Owner | Parcell Tamara | $166,500 |
Source: Public Records
Tax History Compared to Growth
Tax History
| Year | Tax Paid | Tax Assessment Tax Assessment Total Assessment is a certain percentage of the fair market value that is determined by local assessors to be the total taxable value of land and additions on the property. | Land | Improvement |
|---|---|---|---|---|
| 2025 | $5,837 | $302,869 | -- | -- |
| 2024 | $5,618 | $294,048 | -- | -- |
| 2023 | $5,618 | $285,484 | $0 | $0 |
| 2022 | $5,303 | $277,169 | $0 | $0 |
| 2021 | $4,836 | $269,097 | $0 | $0 |
| 2020 | $4,812 | $261,260 | $0 | $0 |
| 2019 | $4,597 | $253,651 | $0 | $0 |
| 2018 | $4,385 | $246,263 | $0 | $0 |
| 2017 | $4,265 | $239,090 | $0 | $0 |
| 2016 | $4,095 | $232,126 | $0 | $0 |
| 2015 | $3,912 | $225,365 | $0 | $0 |
| 2014 | $3,702 | $218,801 | $0 | $0 |
Source: Public Records
Map
Nearby Homes
- 2086 Sunray Cir
- 19874 Bennington Ct
- 2038 Titan Terrace
- 800 Rosemont Rd
- 2005 Carriage Way
- 19686 Sun Cir
- 6135 Cheyenne Terrace
- 19640 Kapteyns St
- 6233 Meridian Cir
- 19661 Sun Cir
- 3029 Club House Ct
- 19655 Sun Cir
- 6275 Clubhouse Cir
- 3088 Club House Ct
- 6296 Belmont Way
- 19775 Wildwood Dr
- 2090 Valley View Dr
- 2024 Conestoga Ln
- 19770 Wildwood Dr
- 19788 Wildwood Dr
- 2095 Sunray Cir
- 2091 Sunray Cir
- 2097 Sunray Cir
- 2089 Sunray Cir
- 2099 Sunray Cir
- 2087 Sunray Cir
- 2092 Sunray Cir
- 2090 Sunray Cir
- 2094 Sunray Cir
- 2090 Sunray Cr
- 2096 Sunray Cir
- 2096 SW Sunray Cr
- 19737 Suncrest Dr
- 2098 Sunray Cir
- 2081 Sunray Cir
- 2088 Sunray Cir
- 19739 Suncrest Dr
- 2079 Sunray Cir
- 19735 Suncrest Dr
- 19790 Suncrest Dr