Estimated Value: $773,000 - $851,000
6
Beds
4
Baths
3,538
Sq Ft
$230/Sq Ft
Est. Value
About This Home
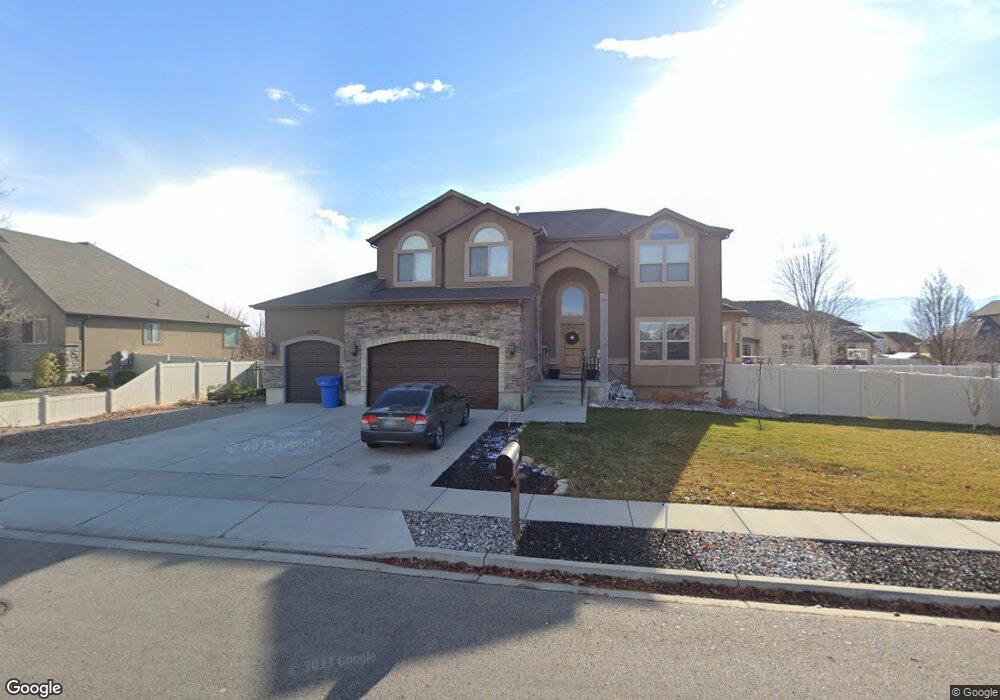
This home is located at 2093 W 1170 S, Lehi, UT 84043 and is currently estimated at $814,074, approximately $230 per square foot. 2093 W 1170 S is a home located in Utah County with nearby schools including Dry Creek Elementary School, Willowcreek Middle School, and Lehi High School.
Ownership History
Date
Name
Owned For
Owner Type
Purchase Details
Closed on
Feb 25, 2022
Sold by
Dallin and Brooke
Bought by
Horch Chad M and Horch Felecia J
Current Estimated Value
Home Financials for this Owner
Home Financials are based on the most recent Mortgage that was taken out on this home.
Original Mortgage
$530,000
Outstanding Balance
$495,191
Interest Rate
3.92%
Mortgage Type
New Conventional
Estimated Equity
$318,883
Purchase Details
Closed on
Jan 28, 2008
Sold by
Oldham Development Lc
Bought by
Dallin Todd and Dallin Brooke
Home Financials for this Owner
Home Financials are based on the most recent Mortgage that was taken out on this home.
Original Mortgage
$382,500
Interest Rate
6.09%
Mortgage Type
Purchase Money Mortgage
Purchase Details
Closed on
Sep 23, 2005
Sold by
Oldham Acres Development Lc
Bought by
Oldham Development Lc
Home Financials for this Owner
Home Financials are based on the most recent Mortgage that was taken out on this home.
Original Mortgage
$340,000
Interest Rate
5.7%
Mortgage Type
Construction
Create a Home Valuation Report for This Property
The Home Valuation Report is an in-depth analysis detailing your home's value as well as a comparison with similar homes in the area
Home Values in the Area
Average Home Value in this Area
Purchase History
| Date | Buyer | Sale Price | Title Company |
|---|---|---|---|
| Horch Chad M | -- | Lydolph & Weierholt Title | |
| Dallin Todd | -- | Mountain West Title Company | |
| Oldham Development Lc | -- | Mountain West Title Company |
Source: Public Records
Mortgage History
| Date | Status | Borrower | Loan Amount |
|---|---|---|---|
| Open | Horch Chad M | $530,000 | |
| Previous Owner | Dallin Todd | $382,500 | |
| Previous Owner | Oldham Development Lc | $340,000 |
Source: Public Records
Tax History Compared to Growth
Tax History
| Year | Tax Paid | Tax Assessment Tax Assessment Total Assessment is a certain percentage of the fair market value that is determined by local assessors to be the total taxable value of land and additions on the property. | Land | Improvement |
|---|---|---|---|---|
| 2025 | $3,121 | $396,000 | $250,300 | $469,700 |
| 2024 | $3,121 | $365,255 | $0 | $0 |
| 2023 | $2,914 | $370,260 | $0 | $0 |
| 2022 | $2,914 | $358,985 | $0 | $0 |
| 2021 | $2,620 | $487,900 | $144,800 | $343,100 |
| 2020 | $2,471 | $454,800 | $134,100 | $320,700 |
| 2019 | $2,195 | $420,100 | $134,100 | $286,000 |
| 2018 | $2,152 | $389,400 | $123,200 | $266,200 |
| 2017 | $2,126 | $204,490 | $0 | $0 |
| 2016 | $2,104 | $187,715 | $0 | $0 |
| 2015 | $2,209 | $183,755 | $0 | $0 |
| 2014 | $2,055 | $173,085 | $0 | $0 |
Source: Public Records
Map
Nearby Homes
- The McKenzie Plan at South Creek
- The Tracie Plan at South Creek
- The Michelle Plan at South Creek
- The Roosevelt Plan at South Creek
- The Avery Plan at South Creek
- The Madison Plan at South Creek
- The Evelyn Plan at South Creek
- The Brandy Plan at South Creek
- The Eleanor Plan at South Creek
- The Christine Plan at South Creek
- 1406 1960 W
- 928 Gander Way
- 2190 W Cape Fox Way Unit 219
- 1137 E Commodore Ln
- 1133 E Commodore Ln
- 811 S 2300 W
- 1178 E Trident Dr
- 1154 E Trident Dr
- 1186 E Dogwatch Dr
- 348 N Broadway Dr Unit 1016