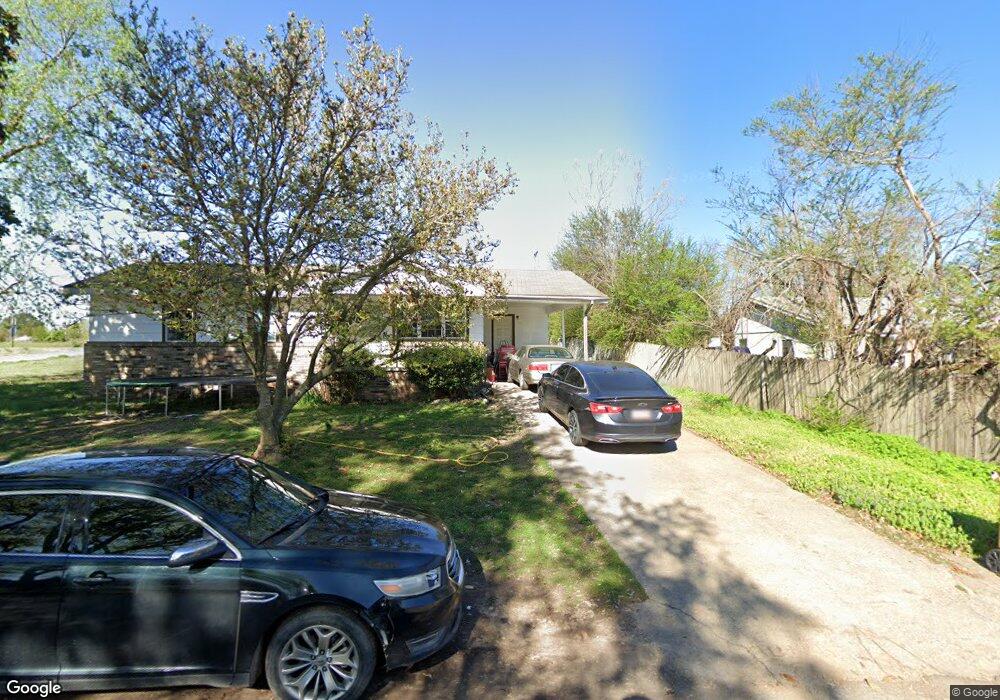
20939 S Rand Ave Tahlequah, OK 74464
Estimated Value: $109,024 - $152,000
3
Beds
1
Bath
1,040
Sq Ft
$118/Sq Ft
Est. Value
About This Home
This home is located at 20939 S Rand Ave, Tahlequah, OK 74464 and is currently estimated at $122,506, approximately $117 per square foot. 20939 S Rand Ave is a home located in Cherokee County with nearby schools including Heritage Elementary School, Tahlequah Middle School, and Tahlequah High School.
Ownership History
Date
Name
Owned For
Owner Type
Purchase Details
Closed on
Jul 10, 2019
Sold by
Littleton Herbert R and Littleton Carolyn J
Bought by
H & C Holdings Llc
Current Estimated Value
Create a Home Valuation Report for This Property
The Home Valuation Report is an in-depth analysis detailing your home's value as well as a comparison with similar homes in the area
Home Values in the Area
Average Home Value in this Area
Purchase History
| Date | Buyer | Sale Price | Title Company |
|---|---|---|---|
| H & C Holdings Llc | -- | None Available |
Source: Public Records
Tax History Compared to Growth
Tax History
| Year | Tax Paid | Tax Assessment Tax Assessment Total Assessment is a certain percentage of the fair market value that is determined by local assessors to be the total taxable value of land and additions on the property. | Land | Improvement |
|---|---|---|---|---|
| 2025 | $446 | $4,937 | $691 | $4,246 |
| 2024 | $446 | $4,702 | $658 | $4,044 |
| 2023 | $446 | $4,477 | $548 | $3,929 |
| 2022 | $396 | $4,264 | $522 | $3,742 |
| 2021 | $378 | $4,061 | $497 | $3,564 |
| 2020 | $367 | $3,868 | $474 | $3,394 |
| 2019 | $346 | $3,683 | $440 | $3,243 |
| 2018 | $333 | $3,508 | $419 | $3,089 |
| 2017 | $317 | $3,342 | $400 | $2,942 |
| 2016 | $304 | $3,182 | $380 | $2,802 |
| 2015 | $272 | $3,031 | $361 | $2,670 |
| 2014 | $272 | $2,887 | $344 | $2,543 |
Source: Public Records
Map
Nearby Homes
- 4684 S 518 Rd
- 216 E Willis Rd
- 3266 Cypress Ln
- 3244 Cypress Ln
- 203 Southridge
- 870 Cherry Springs Dr
- 3270 Cypress Ln
- 768 E Harlan Dr
- 1010 Wilcox Cir
- 1505 Aspen Dr
- 3050 S Muskogee Ave
- 27778 State Highway 82
- 19925 S 503 Rd
- 19971 S 503 Rd
- 19747 S 503 Rd
- 19781 S 503 Rd
- 19920 S 503 Rd
- 19887 S 503 Rd
- 19815 S 503 Rd
- 19970 S 503 Rd
- 20927 S Rand Ave
- 20936 S Rand Ave
- 20913 S Rand Ave
- 20905 S Rand Ave
- 20924 S Rand Ave
- 19055 E Turk St
- 20910 S Rand Ave
- 19016 E Willis Rd
- 20895 S Rand Ave
- 19032 E Willis Rd
- 20935 S Vina Ave
- 20943 S Vina Ave
- 19050 E Willis Rd
- 20923 S Vina Ave
- 20894 S Rand Ave
- 19066 E Willis Rd
- 20885 S Rand Ave
- 19065 E Turk St
- 19080 E Willis Rd
- 20911 S Vina Ave