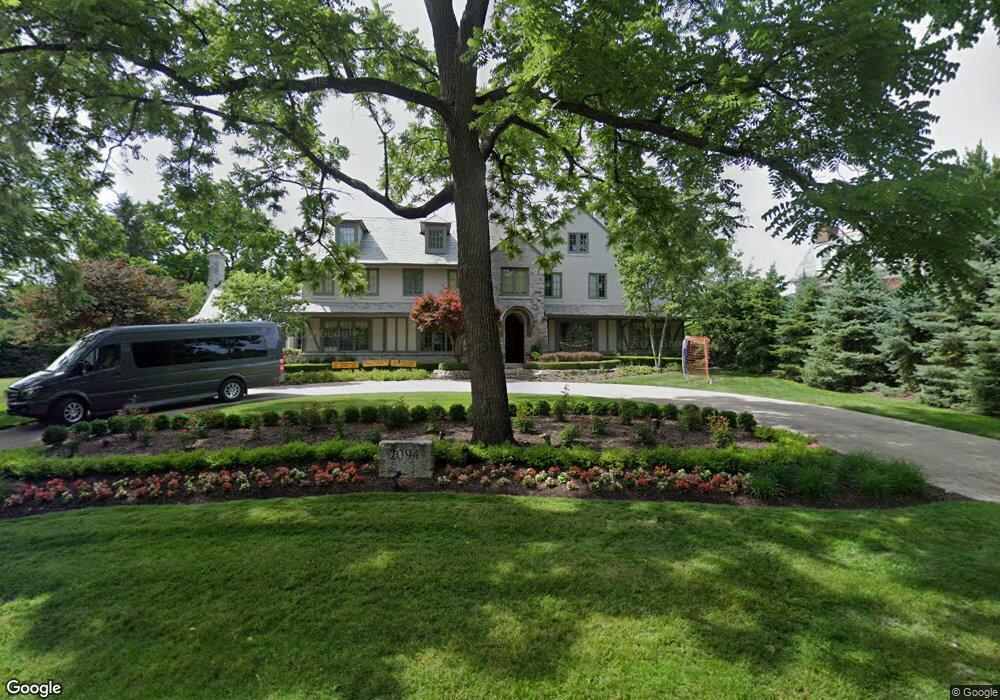
2094 Edgemont Rd Columbus, OH 43212
Estimated Value: $1,885,000 - $2,682,000
5
Beds
5
Baths
7,542
Sq Ft
$311/Sq Ft
Est. Value
About This Home
This home is located at 2094 Edgemont Rd, Columbus, OH 43212 and is currently estimated at $2,345,548, approximately $310 per square foot. 2094 Edgemont Rd is a home located in Franklin County with nearby schools including Barrington Road Elementary School, Jones Middle School, and Upper Arlington High School.
Ownership History
Date
Name
Owned For
Owner Type
Purchase Details
Closed on
Jul 22, 2013
Sold by
Spielman Charles C and Spielman Charles Chris
Bought by
Guy William Gregory and Ingram Elizabeth K
Current Estimated Value
Home Financials for this Owner
Home Financials are based on the most recent Mortgage that was taken out on this home.
Original Mortgage
$885,000
Outstanding Balance
$597,846
Interest Rate
2.62%
Mortgage Type
Adjustable Rate Mortgage/ARM
Estimated Equity
$1,747,702
Purchase Details
Closed on
May 21, 1996
Sold by
Schirmer Mary S
Bought by
Stefanie L Spielman
Home Financials for this Owner
Home Financials are based on the most recent Mortgage that was taken out on this home.
Original Mortgage
$591,750
Interest Rate
7.63%
Mortgage Type
New Conventional
Create a Home Valuation Report for This Property
The Home Valuation Report is an in-depth analysis detailing your home's value as well as a comparison with similar homes in the area
Home Values in the Area
Average Home Value in this Area
Purchase History
| Date | Buyer | Sale Price | Title Company |
|---|---|---|---|
| Guy William Gregory | $1,891,000 | None Available | |
| Stefanie L Spielman | $693,000 | -- |
Source: Public Records
Mortgage History
| Date | Status | Borrower | Loan Amount |
|---|---|---|---|
| Open | Guy William Gregory | $885,000 | |
| Previous Owner | Stefanie L Spielman | $591,750 |
Source: Public Records
Tax History
| Year | Tax Paid | Tax Assessment Tax Assessment Total Assessment is a certain percentage of the fair market value that is determined by local assessors to be the total taxable value of land and additions on the property. | Land | Improvement |
|---|---|---|---|---|
| 2025 | $41,356 | $714,360 | $104,200 | $610,160 |
| 2024 | $41,356 | $714,360 | $104,200 | $610,160 |
| 2023 | $50,597 | $884,940 | $160,300 | $724,640 |
| 2022 | $42,433 | $607,250 | $77,420 | $529,830 |
| 2021 | $37,563 | $607,250 | $77,420 | $529,830 |
| 2020 | $37,230 | $607,250 | $77,420 | $529,830 |
| 2019 | $42,696 | $615,720 | $77,420 | $538,300 |
| 2018 | $41,389 | $602,390 | $77,420 | $524,970 |
| 2017 | $41,414 | $602,390 | $77,420 | $524,970 |
| 2016 | $41,278 | $622,800 | $71,090 | $551,710 |
| 2015 | $41,242 | $622,800 | $71,090 | $551,710 |
| 2014 | $41,189 | $622,800 | $71,090 | $551,710 |
| 2013 | $19,332 | $555,065 | $64,610 | $490,455 |
Source: Public Records
Map
Nearby Homes
- 1960 Hillside Dr
- 2031 Concord Rd
- 2167 Fairfax Rd
- 1631 Roxbury Rd Unit A1
- 1631 Roxbury Rd Unit F3
- 1631 Roxbury Rd Unit B6
- 2015 W 5th Ave Unit 211
- 2015 W 5th Ave Unit 102
- 2015 W 5th Ave Unit 108
- 2329 Keep Place Unit 2329
- 1579 Arlington Ave Unit 1579B
- 1964 Cardigan Ave
- 1869 Tewksbury Rd
- 1523 Wyandotte Rd
- 1621 Waltham Rd Unit B
- 2000 Northwest Blvd Unit D
- 1427 Roxbury Rd Unit Manor House North
- 1410 Arlington Ave
- 1810 Ashland Ave
- 2022 Lake Shore Dr
- 1919 Cambridge Blvd
- 2115 Waltham Rd
- 0 Upper Chelsea Rd
- 2125 Waltham Rd
- 1945 Cambridge Blvd
- 1901 Upper Chelsea Rd
- 1586 Yorkshire Rd
- 2080 Stanford Rd
- 1895 Cambridge Blvd
- 1911 Upper Chelsea Rd
- 2155 Waltham Rd
- 1875 Roxbury Rd
- 1950 Cambridge Blvd
- 1954 Upper Chelsea Rd
- 1971 Cambridge Blvd
- 1930 Cambridge Blvd
- 1865 Upper Chelsea Rd
- 1940 Cambridge Blvd
- 1850 Upper Chelsea Rd
- 1955 Upper Chelsea Rd
Your Personal Tour Guide
Ask me questions while you tour the home.