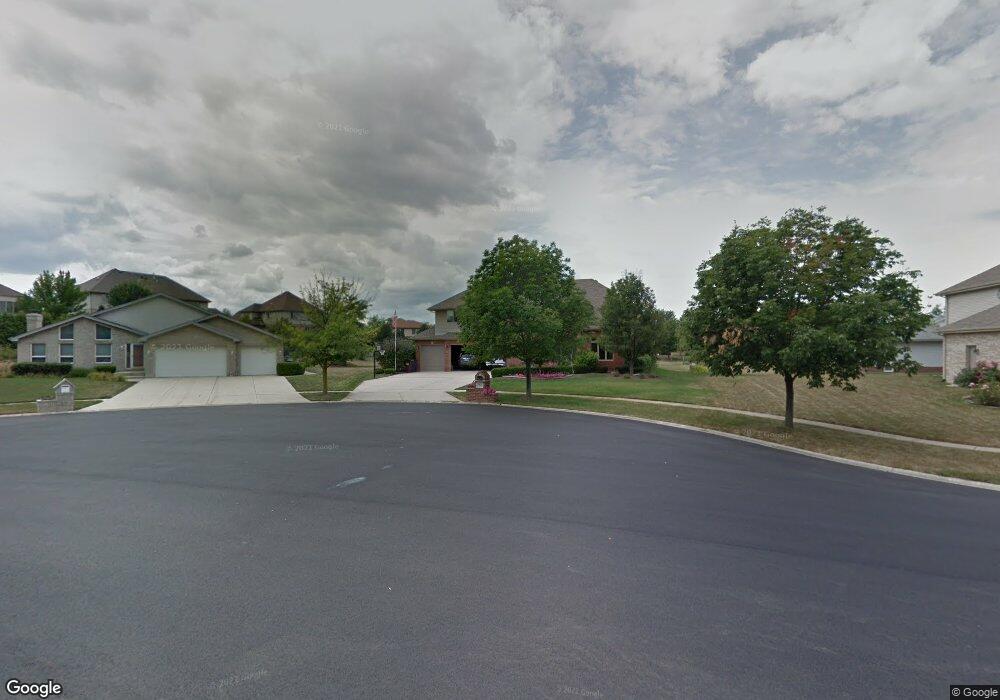
20945 Roscommon Ct Mokena, IL 60448
Estimated Value: $646,000 - $854,000
4
Beds
3
Baths
3,600
Sq Ft
$199/Sq Ft
Est. Value
About This Home
This home is located at 20945 Roscommon Ct, Mokena, IL 60448 and is currently estimated at $717,494, approximately $199 per square foot. 20945 Roscommon Ct is a home located in Will County with nearby schools including Mokena Elementary School, Mokena Intermediate School, and Mokena Jr High School.
Ownership History
Date
Name
Owned For
Owner Type
Purchase Details
Closed on
Mar 2, 2009
Sold by
Godsil Joseph M and Godsil Natalie A
Bought by
Vangennep John R and Vangennep Van Gennep
Current Estimated Value
Home Financials for this Owner
Home Financials are based on the most recent Mortgage that was taken out on this home.
Original Mortgage
$300,000
Interest Rate
5.05%
Mortgage Type
Purchase Money Mortgage
Purchase Details
Closed on
Feb 26, 2002
Sold by
Horizon Homes Inc
Bought by
Godsil Joseph M and Godsil Natalie A
Home Financials for this Owner
Home Financials are based on the most recent Mortgage that was taken out on this home.
Original Mortgage
$312,000
Interest Rate
6.25%
Purchase Details
Closed on
Jan 19, 2001
Sold by
Jirik Thomas E and Jirik Sherry L
Bought by
Horizon Homes Inc
Purchase Details
Closed on
Apr 30, 1997
Sold by
Southwest Financial Bank & Trust Company
Bought by
Jirik Thomas E and Jirik Sherry L
Home Financials for this Owner
Home Financials are based on the most recent Mortgage that was taken out on this home.
Original Mortgage
$43,000
Interest Rate
8%
Create a Home Valuation Report for This Property
The Home Valuation Report is an in-depth analysis detailing your home's value as well as a comparison with similar homes in the area
Home Values in the Area
Average Home Value in this Area
Purchase History
| Date | Buyer | Sale Price | Title Company |
|---|---|---|---|
| Vangennep John R | $450,000 | None Available | |
| Godsil Joseph M | $390,000 | -- | |
| Horizon Homes Inc | $75,000 | -- | |
| Jirik Thomas E | $72,000 | -- |
Source: Public Records
Mortgage History
| Date | Status | Borrower | Loan Amount |
|---|---|---|---|
| Previous Owner | Vangennep John R | $300,000 | |
| Previous Owner | Godsil Joseph M | $312,000 | |
| Previous Owner | Jirik Thomas E | $43,000 |
Source: Public Records
Tax History
| Year | Tax Paid | Tax Assessment Tax Assessment Total Assessment is a certain percentage of the fair market value that is determined by local assessors to be the total taxable value of land and additions on the property. | Land | Improvement |
|---|---|---|---|---|
| 2024 | $14,106 | $199,349 | $49,410 | $149,939 |
| 2023 | $14,106 | $178,038 | $44,128 | $133,910 |
| 2022 | $12,364 | $162,162 | $40,193 | $121,969 |
| 2021 | $11,676 | $151,709 | $37,602 | $114,107 |
| 2020 | $11,435 | $147,433 | $36,542 | $110,891 |
| 2019 | $11,081 | $143,487 | $35,564 | $107,923 |
| 2018 | $10,728 | $139,362 | $34,542 | $104,820 |
| 2017 | $10,540 | $136,109 | $33,736 | $102,373 |
| 2016 | $10,256 | $131,442 | $32,579 | $98,863 |
| 2015 | $10,004 | $126,814 | $31,432 | $95,382 |
| 2014 | $10,004 | $125,933 | $31,214 | $94,719 |
| 2013 | $10,004 | $127,566 | $31,619 | $95,947 |
Source: Public Records
Map
Nearby Homes
- 21170 Sage Brush Ln
- 21334 Sage Brush Ln
- 11140 Lincoln Hwy
- 21647 S Owens Rd
- 21580 Skyway Dr
- 732 Teal Dr Unit 1
- 320 Garfield Ave
- 2402 Bluestone Bay Dr
- 11550 Francis Rd
- 719 Stonebridge Rd
- 1750 Orchard Ln
- 1564 Glenbrooke Ln Unit 2
- 21942 Princeton Cir
- 1738 Orchard Ln
- 1558 Glenbrooke Ln
- 11125 Denny Ave
- 11144 Denny Ave
- 1351 E Lincoln Hwy
- 20044 S Kohlwood Dr
- 425 Cottonwood Rd
- 20947 Roscommon Ct
- 20943 Roscommon Ct
- 11501 Abbey Rd
- 11507 Abbey Rd
- 11500 Stratford Rd
- 20948 Roscommon Ct
- 11423 Abbey Rd
- 20951 Bradford Dr
- 11448 Stratford Rd
- 11506 Stratford Rd
- 20957 Bradford Dr
- 20945 Bradford Dr
- 20946 Roscommon Ct
- 11438 Stratford Rd
- 11510 Stratford Rd
- 11500 Abbey Rd
- 11444 Abbey Rd
- 11411 Abbey Rd
- 11511 Abbey Rd
- 11428 Stratford Rd
Your Personal Tour Guide
Ask me questions while you tour the home.