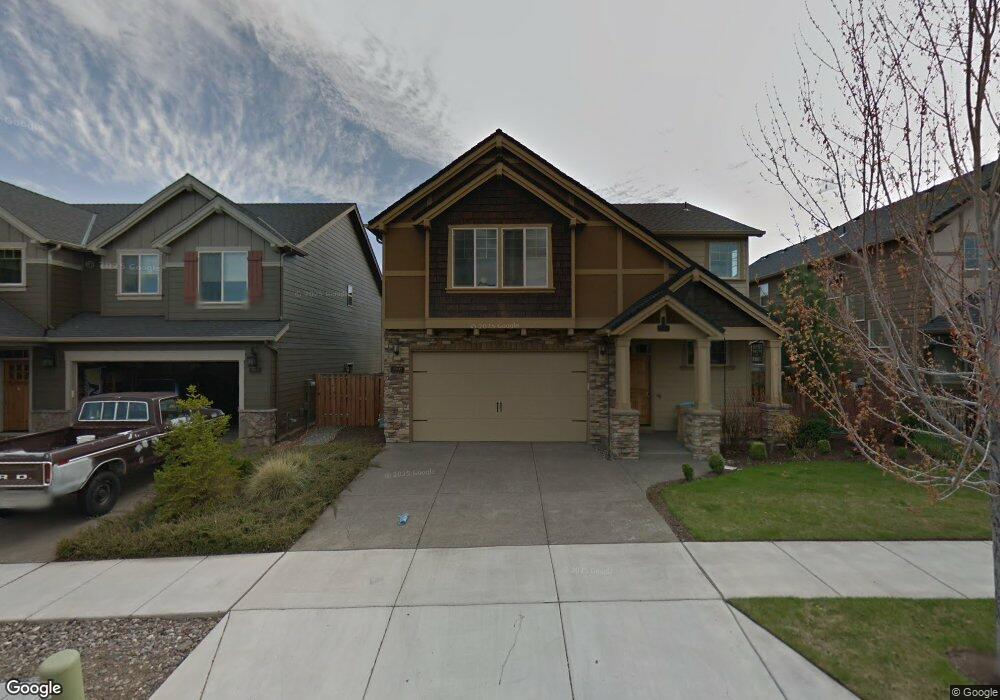
20949 Lava Flow Ln Bend, OR 97701
Boyd Acres NeighborhoodEstimated Value: $681,123 - $753,000
3
Beds
3
Baths
2,154
Sq Ft
$329/Sq Ft
Est. Value
About This Home
This home is located at 20949 Lava Flow Ln, Bend, OR 97701 and is currently estimated at $707,781, approximately $328 per square foot. 20949 Lava Flow Ln is a home located in Deschutes County with nearby schools including Ponderosa Elementary School, Sky View Middle School, and Mountain View Senior High School.
Ownership History
Date
Name
Owned For
Owner Type
Purchase Details
Closed on
Jul 11, 2009
Sold by
Bank Of America National Association
Bought by
Berman Casey W and Berman Tiffanie Gale
Current Estimated Value
Home Financials for this Owner
Home Financials are based on the most recent Mortgage that was taken out on this home.
Original Mortgage
$184,000
Outstanding Balance
$119,231
Interest Rate
5.25%
Mortgage Type
Unknown
Estimated Equity
$588,550
Purchase Details
Closed on
Apr 15, 2009
Sold by
Davis Holly L and Davis Matthew B
Bought by
Lasalle Bank Na
Purchase Details
Closed on
Jul 20, 2005
Sold by
Pahlisch Homes Inc
Bought by
Davis Matthew B and Davis Holly L
Home Financials for this Owner
Home Financials are based on the most recent Mortgage that was taken out on this home.
Original Mortgage
$49,295
Interest Rate
5.46%
Mortgage Type
Credit Line Revolving
Create a Home Valuation Report for This Property
The Home Valuation Report is an in-depth analysis detailing your home's value as well as a comparison with similar homes in the area
Home Values in the Area
Average Home Value in this Area
Purchase History
| Date | Buyer | Sale Price | Title Company |
|---|---|---|---|
| Berman Casey W | $230,000 | Multiple | |
| Lasalle Bank Na | $238,000 | Amerititle | |
| Davis Matthew B | $328,633 | Amerititle | |
| Pahlisch Homes Inc | $68,000 | Amerititle |
Source: Public Records
Mortgage History
| Date | Status | Borrower | Loan Amount |
|---|---|---|---|
| Open | Berman Casey W | $184,000 | |
| Previous Owner | Pahlisch Homes Inc | $49,295 | |
| Previous Owner | Davis Matthew B | $262,906 |
Source: Public Records
Tax History
| Year | Tax Paid | Tax Assessment Tax Assessment Total Assessment is a certain percentage of the fair market value that is determined by local assessors to be the total taxable value of land and additions on the property. | Land | Improvement |
|---|---|---|---|---|
| 2025 | $4,116 | $243,580 | -- | -- |
| 2024 | $3,960 | $236,490 | -- | -- |
| 2023 | $3,671 | $229,610 | $0 | $0 |
| 2022 | $3,425 | $216,440 | $0 | $0 |
| 2021 | $3,430 | $210,140 | $0 | $0 |
| 2020 | $3,254 | $210,140 | $0 | $0 |
| 2019 | $3,163 | $204,020 | $0 | $0 |
| 2018 | $3,074 | $198,080 | $0 | $0 |
| 2017 | $2,984 | $192,320 | $0 | $0 |
| 2016 | $2,846 | $186,720 | $0 | $0 |
| 2015 | $2,767 | $181,290 | $0 | $0 |
| 2014 | $2,686 | $176,010 | $0 | $0 |
Source: Public Records
Map
Nearby Homes
- 63091 Desert Sage St
- 20991 NE Legend Place
- 63037 Yampa Way
- 20970 Lupine Ave
- 20972 NE High Desert Ln
- 20798 NE Sierra Dr
- 20786 NE Comet Ln
- 20779 Boulderfield Ave
- 20810 Cassin Dr
- 20745 NE Comet Ln
- 63148 NE Hadley Place
- 63153 NE Hadley Place
- 63169 NE Hadley Place
- 63232 Wishing Well Ln
- 3343 NE Stonebrook Loop
- 62906 Bilyeu Way
- 20677 NE Comet Ct
- 63150 Peale St
- 20695 Town Dr
- 20731 Justice Ct
- 20943 Lava Flow Ln
- 20955 Lava Flow Ln
- 20926 Kodiak Ct Unit Lot49
- 20926 Kodiak Ct
- 20932 Kodiak Ct Unit Lot50
- 20932 Kodiak Ct
- 20961 Lava Flow Ln
- 20920 Kodiak Ct Unit Lot48
- 20914 Kodiak Ct Unit Lot47
- 20914 Kodiak Ct
- 20938 Kodiak Ct
- 20944 Lava Flow Ln
- 20967 Lava Flow Ln
- 20956 Lava Flow Ln
- 52 Lava Flow Ln
- 20962 Lava Flow Ln
- 20968 Lava Flow Ln
- 20973 Lava Flow Ln
- 63165 Brookstone Ln
Your Personal Tour Guide
Ask me questions while you tour the home.