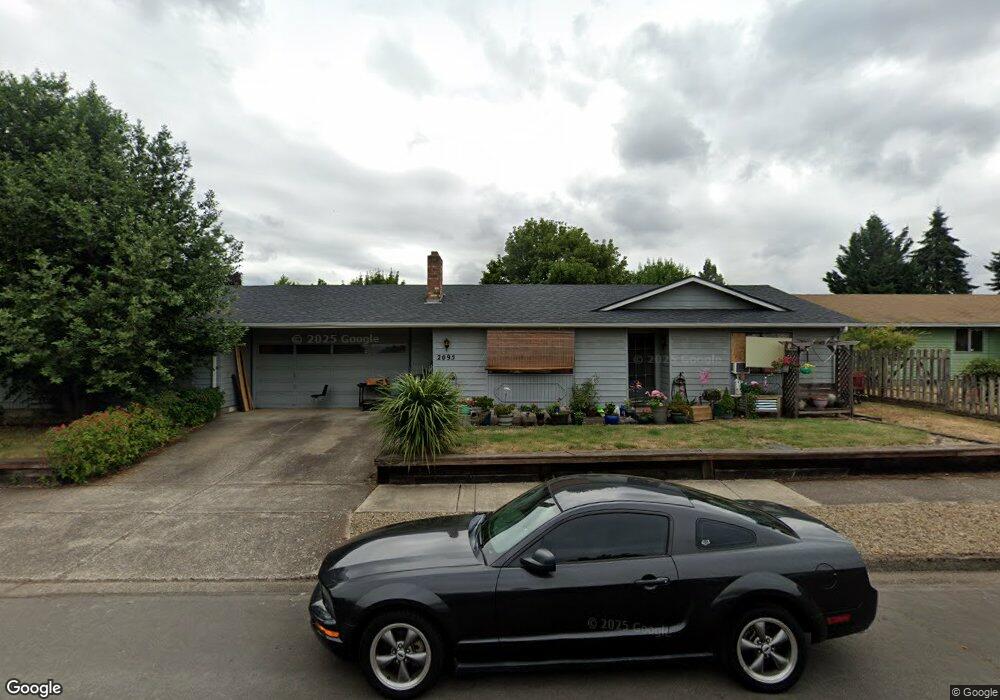
2095 7th St Springfield, OR 97477
North Springfield NeighborhoodEstimated Value: $485,000 - $521,000
4
Beds
2
Baths
1,896
Sq Ft
$268/Sq Ft
Est. Value
About This Home
This home is located at 2095 7th St, Springfield, OR 97477 and is currently estimated at $508,502, approximately $268 per square foot. 2095 7th St is a home located in Lane County with nearby schools including Elizabeth Page Elementary School, Briggs Middle School, and Springfield High School.
Ownership History
Date
Name
Owned For
Owner Type
Purchase Details
Closed on
Apr 30, 2025
Sold by
Medford Family Trust and Barnum Denise
Bought by
Wimberly Alisha and Menser Graham Gale
Current Estimated Value
Home Financials for this Owner
Home Financials are based on the most recent Mortgage that was taken out on this home.
Original Mortgage
$390,000
Outstanding Balance
$387,925
Interest Rate
6.67%
Mortgage Type
New Conventional
Estimated Equity
$120,577
Purchase Details
Closed on
Dec 10, 1999
Sold by
Medford Bill D
Bought by
Medford Bill and Medford Bev
Create a Home Valuation Report for This Property
The Home Valuation Report is an in-depth analysis detailing your home's value as well as a comparison with similar homes in the area
Home Values in the Area
Average Home Value in this Area
Purchase History
| Date | Buyer | Sale Price | Title Company |
|---|---|---|---|
| Wimberly Alisha | $520,000 | Cascade Title | |
| Medford Bill | -- | -- |
Source: Public Records
Mortgage History
| Date | Status | Borrower | Loan Amount |
|---|---|---|---|
| Open | Wimberly Alisha | $390,000 |
Source: Public Records
Tax History
| Year | Tax Paid | Tax Assessment Tax Assessment Total Assessment is a certain percentage of the fair market value that is determined by local assessors to be the total taxable value of land and additions on the property. | Land | Improvement |
|---|---|---|---|---|
| 2025 | $4,689 | $255,685 | -- | -- |
| 2024 | $4,613 | $248,238 | -- | -- |
| 2023 | $4,613 | $241,008 | -- | -- |
| 2022 | $4,272 | $233,989 | $0 | $0 |
| 2021 | $4,195 | $227,174 | $0 | $0 |
| 2020 | $4,073 | $220,558 | $0 | $0 |
| 2019 | $3,950 | $214,134 | $0 | $0 |
| 2018 | $3,724 | $201,843 | $0 | $0 |
| 2017 | $3,581 | $201,843 | $0 | $0 |
| 2016 | $3,470 | $195,964 | $0 | $0 |
| 2015 | $3,398 | $190,256 | $0 | $0 |
| 2014 | $3,343 | $184,715 | $0 | $0 |
Source: Public Records
Map
Nearby Homes
Your Personal Tour Guide
Ask me questions while you tour the home.