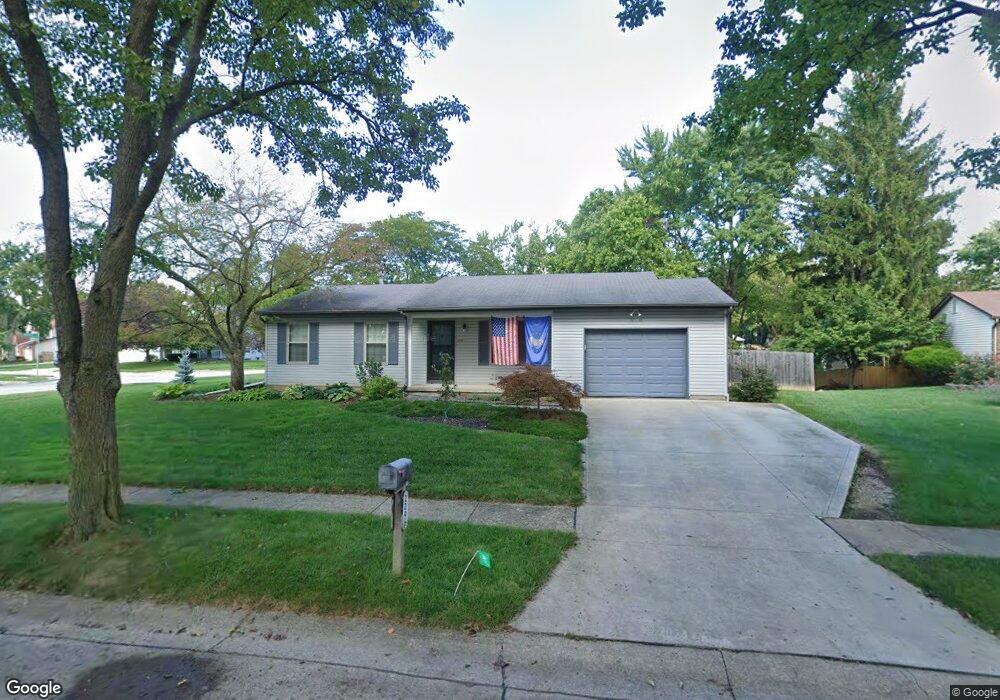
2096 Flanders Ct Columbus, OH 43235
Brookside Colony NeighborhoodEstimated Value: $329,000 - $366,000
2
Beds
2
Baths
1,350
Sq Ft
$256/Sq Ft
Est. Value
About This Home
This home is located at 2096 Flanders Ct, Columbus, OH 43235 and is currently estimated at $345,525, approximately $255 per square foot. 2096 Flanders Ct is a home located in Franklin County with nearby schools including Indian Run Elementary School, Ann Simpson Davis Middle School, and Dublin Scioto High School.
Ownership History
Date
Name
Owned For
Owner Type
Purchase Details
Closed on
Jul 20, 2011
Sold by
Stange Penny and Stange Stephen D
Bought by
Blose Christopher D
Current Estimated Value
Home Financials for this Owner
Home Financials are based on the most recent Mortgage that was taken out on this home.
Original Mortgage
$94,899
Outstanding Balance
$65,257
Interest Rate
4.5%
Mortgage Type
FHA
Estimated Equity
$280,268
Purchase Details
Closed on
Oct 2, 1989
Purchase Details
Closed on
Aug 1, 1986
Create a Home Valuation Report for This Property
The Home Valuation Report is an in-depth analysis detailing your home's value as well as a comparison with similar homes in the area
Home Values in the Area
Average Home Value in this Area
Purchase History
| Date | Buyer | Sale Price | Title Company |
|---|---|---|---|
| Blose Christopher D | $117,000 | Talon Group | |
| -- | $78,900 | -- | |
| -- | $70,000 | -- |
Source: Public Records
Mortgage History
| Date | Status | Borrower | Loan Amount |
|---|---|---|---|
| Open | Blose Christopher D | $94,899 |
Source: Public Records
Tax History Compared to Growth
Tax History
| Year | Tax Paid | Tax Assessment Tax Assessment Total Assessment is a certain percentage of the fair market value that is determined by local assessors to be the total taxable value of land and additions on the property. | Land | Improvement |
|---|---|---|---|---|
| 2024 | $5,731 | $94,750 | $36,400 | $58,350 |
| 2023 | $5,650 | $94,745 | $36,400 | $58,345 |
| 2022 | $3,967 | $61,820 | $25,870 | $35,950 |
| 2021 | $4,031 | $61,820 | $25,870 | $35,950 |
| 2020 | $4,007 | $61,820 | $25,870 | $35,950 |
| 2019 | $3,721 | $50,820 | $21,560 | $29,260 |
| 2018 | $3,747 | $50,820 | $21,560 | $29,260 |
| 2017 | $3,435 | $50,820 | $21,560 | $29,260 |
| 2016 | $3,735 | $51,910 | $16,280 | $35,630 |
| 2015 | $3,759 | $51,910 | $16,280 | $35,630 |
| 2014 | $3,762 | $51,910 | $16,280 | $35,630 |
| 2013 | $1,910 | $51,905 | $16,275 | $35,630 |
Source: Public Records
Map
Nearby Homes
- 2056 Fincastle Ct
- 6921 Spruce Pine Dr
- 2161 Heatherfield Ave
- 1930 Shallowford Ave
- 7373 Palmleaf Ln
- 2001 Sawbury Blvd Unit 2001
- 1889 Slaton Ct Unit 1889
- 1721 Worthington Run Dr Unit 1721-1731
- 2392 Dunsworth Dr
- 2220 Surreygate Dr
- 1828 Gardenstone Dr
- 1637 Park Row Dr Unit F
- 1620 Park Row Dr Unit A
- 2687 Snouffer Rd
- 2074 Hard Rd
- 2456 Sanford Dr
- 2469 Sandstrom Dr
- 7734 Henry David Ct
- 7385 Cimmaron Station
- 2533 Timberside Dr
- 6968 Maybrook St
- 2088 Flanders Ct
- 6976 Maybrook St
- 6932 Maybrook St
- 2080 Flanders Ct
- 6935 Maybrook St
- 2079 Flanders Ct
- 2120 Everton Place
- 6936 Gray Gables Ln
- 6984 Maybrook St
- 2072 Flanders Ct
- 2081 Fincastle Ct
- 2073 Fincastle Ct
- 2071 Flanders Ct
- 6927 Maybrook St
- 6928 Gray Gables Ln
- 2123 Heatherfield Ave
- 2128 Everton Place
- 6924 Maybrook St
- 2111 Queensbridge Dr