Estimated Value: $760,000 - $908,000
6
Beds
4
Baths
3,530
Sq Ft
$236/Sq Ft
Est. Value
About This Home
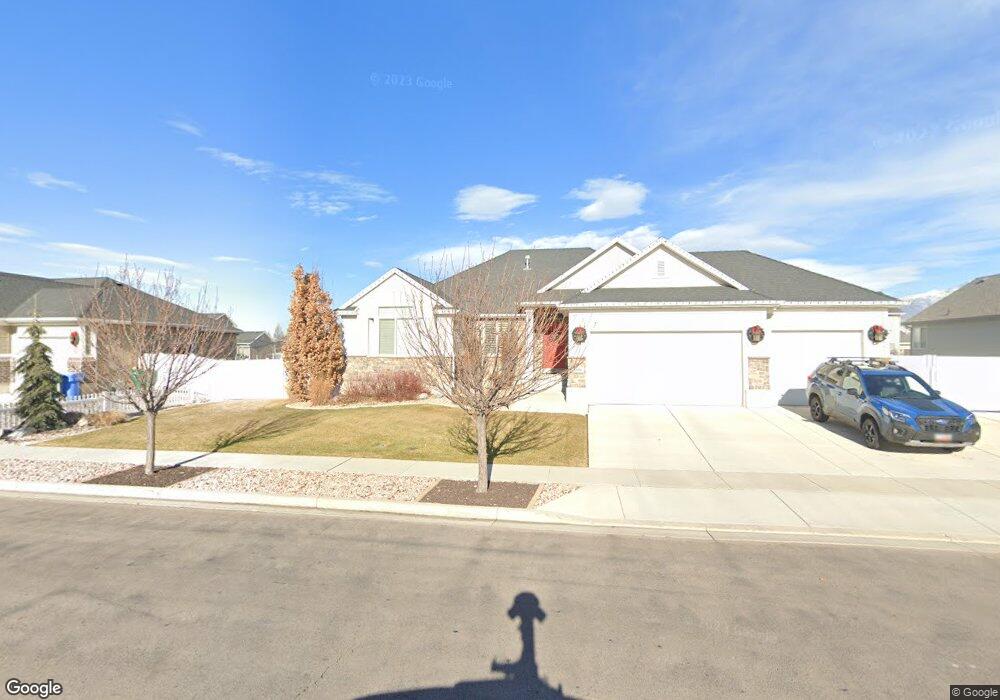
This home is located at 2096 W 450 N, Lehi, UT 84043 and is currently estimated at $833,205, approximately $236 per square foot. 2096 W 450 N is a home located in Utah County with nearby schools including River Rock Elementary, Willowcreek Middle School, and Lehi High School.
Ownership History
Date
Name
Owned For
Owner Type
Purchase Details
Closed on
Jun 26, 2020
Sold by
Woodruff Thomas and Woodruff Stacy J
Bought by
Boyack Christen Edward and Boyack Elizabeth Ann
Current Estimated Value
Home Financials for this Owner
Home Financials are based on the most recent Mortgage that was taken out on this home.
Original Mortgage
$420,000
Outstanding Balance
$372,428
Interest Rate
3.1%
Mortgage Type
New Conventional
Estimated Equity
$460,777
Purchase Details
Closed on
Dec 16, 2019
Sold by
Woodruff Thomas and Woodruff Stacy
Bought by
Woodruff Thomas and Woodruff Stacy
Purchase Details
Closed on
Oct 21, 2013
Sold by
Woodruff Thomas
Bought by
Woodruff Thomas and Woodruff Stacy J
Home Financials for this Owner
Home Financials are based on the most recent Mortgage that was taken out on this home.
Original Mortgage
$267,656
Interest Rate
4.55%
Mortgage Type
New Conventional
Create a Home Valuation Report for This Property
The Home Valuation Report is an in-depth analysis detailing your home's value as well as a comparison with similar homes in the area
Home Values in the Area
Average Home Value in this Area
Purchase History
| Date | Buyer | Sale Price | Title Company |
|---|---|---|---|
| Boyack Christen Edward | -- | Greenbrier Ttl Ins Agcy Inc | |
| Woodruff Thomas | -- | Vanguard Title Ins Agcy Llc | |
| Woodruff Thomas | -- | Cottonwood Title Ins Agency | |
| Woodruff Thomas | -- | Cottonwood Title Ins Agency | |
| Ivory Homes Ltd | -- | Cottonwood Title Ins Agency |
Source: Public Records
Mortgage History
| Date | Status | Borrower | Loan Amount |
|---|---|---|---|
| Open | Boyack Christen Edward | $420,000 | |
| Previous Owner | Woodruff Thomas | $267,656 |
Source: Public Records
Tax History Compared to Growth
Tax History
| Year | Tax Paid | Tax Assessment Tax Assessment Total Assessment is a certain percentage of the fair market value that is determined by local assessors to be the total taxable value of land and additions on the property. | Land | Improvement |
|---|---|---|---|---|
| 2025 | $3,417 | $429,660 | $283,900 | $497,300 |
| 2024 | $3,417 | $399,850 | $0 | $0 |
| 2023 | $3,189 | $405,185 | $0 | $0 |
| 2022 | $3,156 | $388,740 | $0 | $0 |
| 2021 | $2,825 | $526,100 | $164,300 | $361,800 |
| 2020 | $2,663 | $490,200 | $152,100 | $338,100 |
| 2019 | $2,216 | $424,000 | $152,100 | $271,900 |
| 2018 | $2,104 | $380,700 | $130,400 | $250,300 |
| 2017 | $2,083 | $200,310 | $0 | $0 |
| 2016 | $2,161 | $192,885 | $0 | $0 |
| 2015 | $2,021 | $171,160 | $0 | $0 |
| 2014 | $2,024 | $170,445 | $0 | $0 |
Source: Public Records
Map
Nearby Homes
- 373 N Willow Haven Ave
- 41 N 2150 W
- 2162 W Main St Unit E303
- 2178 W Main St Unit D301
- 2512 W 610 N Unit 99
- 122 N 2430 W Unit 1
- 105 N 2430 W
- The Roslyn Plan at Carla's Cove
- The Tracie Plan at Carla's Cove
- The Brooke Plan at Carla's Cove
- The Jackie Plan at Carla's Cove
- 131 S 1900 W Unit 2
- 202 S 2035 W
- 210 S Tamarak Cir
- 1784 W Grays Place
- 1127 N 1500 W
- 1743 W Grays Place
- 1302 N 2450 W
- 161 S 1475 W
- 1032 Titan Dr