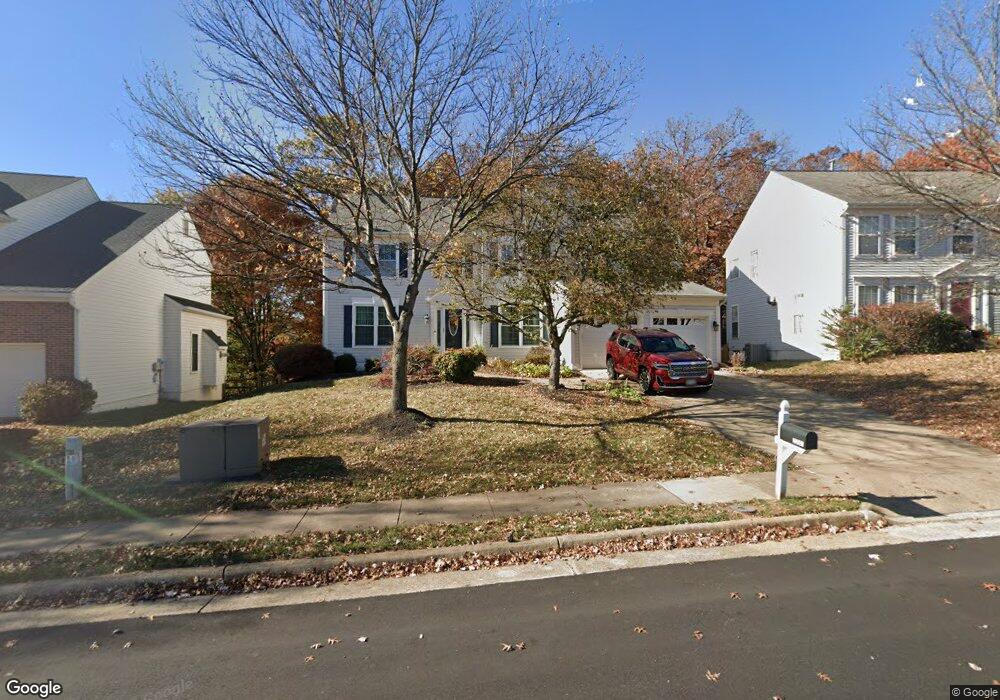
20961 Fowlers Mill Cir Ashburn, VA 20147
Estimated Value: $912,788 - $951,000
4
Beds
4
Baths
2,478
Sq Ft
$375/Sq Ft
Est. Value
About This Home
This home is located at 20961 Fowlers Mill Cir, Ashburn, VA 20147 and is currently estimated at $930,197, approximately $375 per square foot. 20961 Fowlers Mill Cir is a home located in Loudoun County with nearby schools including Dominion Trail Elementary School, Farmwell Station Middle School, and Broad Run High School.
Ownership History
Date
Name
Owned For
Owner Type
Purchase Details
Closed on
Jun 23, 2005
Sold by
Burns John J
Bought by
Paul Linda S
Current Estimated Value
Home Financials for this Owner
Home Financials are based on the most recent Mortgage that was taken out on this home.
Original Mortgage
$325,000
Outstanding Balance
$170,324
Interest Rate
5.82%
Mortgage Type
New Conventional
Estimated Equity
$759,873
Purchase Details
Closed on
Nov 22, 1994
Sold by
Kettler Forlines Inc
Bought by
Burns John J
Home Financials for this Owner
Home Financials are based on the most recent Mortgage that was taken out on this home.
Original Mortgage
$203,150
Interest Rate
8.9%
Purchase Details
Closed on
Jul 13, 1994
Sold by
Ashburn Vil Dev Corp
Bought by
Kettler Forlines Inc
Create a Home Valuation Report for This Property
The Home Valuation Report is an in-depth analysis detailing your home's value as well as a comparison with similar homes in the area
Home Values in the Area
Average Home Value in this Area
Purchase History
| Date | Buyer | Sale Price | Title Company |
|---|---|---|---|
| Paul Linda S | $650,000 | -- | |
| Burns John J | $257,070 | -- | |
| Kettler Forlines Inc | $201,577 | -- |
Source: Public Records
Mortgage History
| Date | Status | Borrower | Loan Amount |
|---|---|---|---|
| Open | Paul Linda S | $325,000 | |
| Previous Owner | Kettler Forlines Inc | $203,150 |
Source: Public Records
Tax History Compared to Growth
Tax History
| Year | Tax Paid | Tax Assessment Tax Assessment Total Assessment is a certain percentage of the fair market value that is determined by local assessors to be the total taxable value of land and additions on the property. | Land | Improvement |
|---|---|---|---|---|
| 2025 | $6,896 | $856,630 | $299,200 | $557,430 |
| 2024 | $6,972 | $806,030 | $294,200 | $511,830 |
| 2023 | $6,826 | $780,140 | $294,200 | $485,940 |
| 2022 | $6,600 | $741,560 | $269,200 | $472,360 |
| 2021 | $6,172 | $629,770 | $219,200 | $410,570 |
| 2020 | $6,098 | $589,180 | $197,600 | $391,580 |
| 2019 | $6,041 | $578,090 | $197,600 | $380,490 |
| 2018 | $5,714 | $526,650 | $177,600 | $349,050 |
| 2017 | $5,788 | $514,470 | $177,600 | $336,870 |
| 2016 | $5,937 | $518,530 | $0 | $0 |
| 2015 | $5,834 | $336,440 | $0 | $336,440 |
| 2014 | $5,790 | $323,660 | $0 | $323,660 |
Source: Public Records
Map
Nearby Homes
- 43949 Bruceton Mills Cir
- 43834 Jenkins Ln
- 20857 Ashburn Rd
- 43866 Laburnum Square
- 43876 Laburnum Square
- 20624 Camptown Ct
- 43800 Stonebridge Dr
- 44135 Tippecanoe Terrace
- 44092 Natalie Terrace Unit 302
- 20600 Cornstalk Terrace Unit 202
- 21250 Dubois Ct
- 20576 Ashburn Rd
- 44152 Natalie Terrace Unit 201
- 43485 Plantation Terrace
- 20961 Cohasset Terrace
- 44049 Florence Terrace
- 44248 Suscon Square
- 43494 Postrail Square
- 44231 Litchfield Terrace
- 21081 Bitterroot Terrace
- 20957 Fowlers Mill Cir
- 20965 Fowlers Mill Cir
- 20953 Fowlers Mill Cir
- 20969 Fowlers Mill Cir
- 20949 Fowlers Mill Cir
- 20972 Fowlers Mill Cir
- 20948 Fowlers Mill Cir
- 20945 Fowlers Mill Cir
- 20964 Fowlers Mill Cir
- 20976 Fowlers Mill Cir
- 20909 Rubles Mill Ct
- 20952 Fowlers Mill Cir
- 20928 Fowlers Mill Cir
- 20960 Fowlers Mill Cir
- 20956 Fowlers Mill Cir
- 20941 Fowlers Mill Cir
- 20980 Fowlers Mill Cir
- 20913 Rubles Mill Ct
- 20981 Fowlers Mill Cir
- 20916 Rubles Mill Ct