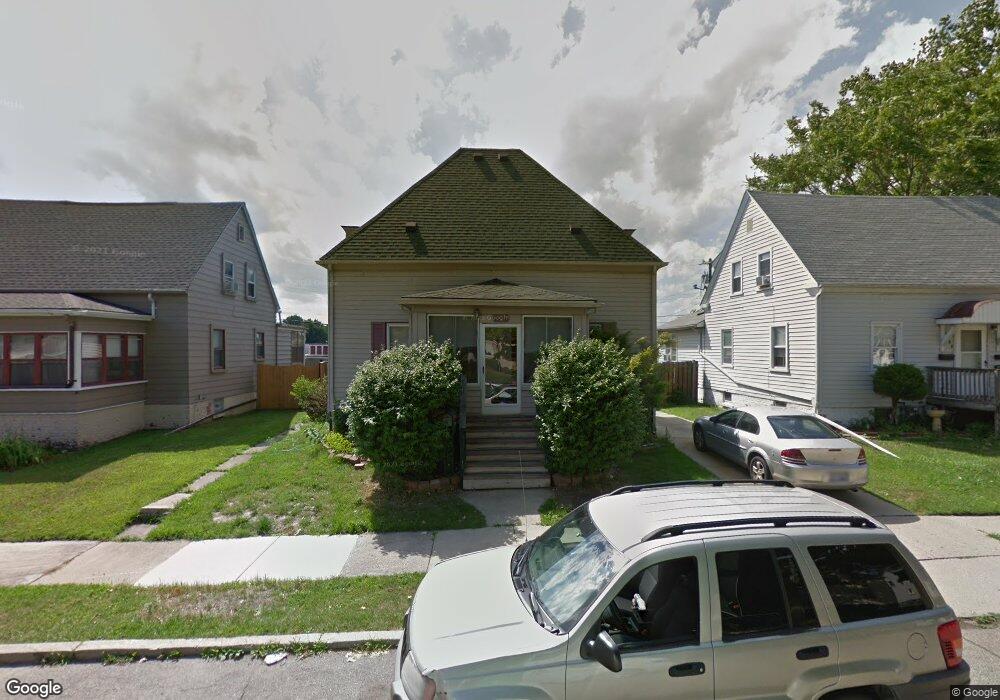
2098 5th St Wyandotte, MI 48192
Estimated Value: $192,000 - $213,000
--
Bed
2
Baths
1,362
Sq Ft
$151/Sq Ft
Est. Value
About This Home
This home is located at 2098 5th St, Wyandotte, MI 48192 and is currently estimated at $205,977, approximately $151 per square foot. 2098 5th St is a home located in Wayne County with nearby schools including James A. Garfield Elementary School, Woodrow Wilson School, and Roosevelt High School.
Ownership History
Date
Name
Owned For
Owner Type
Purchase Details
Closed on
Jun 12, 2007
Sold by
Jackson Alphonso R
Bought by
King Ii William
Current Estimated Value
Purchase Details
Closed on
Sep 26, 2006
Sold by
Mortgage Electronic Registration Systems
Bought by
Hud
Purchase Details
Closed on
Mar 8, 2006
Sold by
Johnson Charles H and Johnson Stacey M
Bought by
Mortgage Electronic Registration Systems and Watermark Financial Partner Inc
Purchase Details
Closed on
Jan 6, 1998
Sold by
Heilshorn Jane and Heilshorn Paul
Bought by
Hjohnson Charles
Create a Home Valuation Report for This Property
The Home Valuation Report is an in-depth analysis detailing your home's value as well as a comparison with similar homes in the area
Home Values in the Area
Average Home Value in this Area
Purchase History
| Date | Buyer | Sale Price | Title Company |
|---|---|---|---|
| King Ii William | $70,800 | None Available | |
| Hud | -- | Attorneys Title Agency Llc | |
| Mortgage Electronic Registration Systems | $110,563 | None Available | |
| Hjohnson Charles | $46,500 | -- |
Source: Public Records
Tax History Compared to Growth
Tax History
| Year | Tax Paid | Tax Assessment Tax Assessment Total Assessment is a certain percentage of the fair market value that is determined by local assessors to be the total taxable value of land and additions on the property. | Land | Improvement |
|---|---|---|---|---|
| 2025 | $2,003 | $95,200 | $0 | $0 |
| 2024 | $2,003 | $83,900 | $0 | $0 |
| 2023 | $1,910 | $74,100 | $0 | $0 |
| 2022 | $2,213 | $63,900 | $0 | $0 |
| 2021 | $2,169 | $55,600 | $0 | $0 |
| 2020 | $2,139 | $47,900 | $0 | $0 |
| 2019 | $2,109 | $43,800 | $0 | $0 |
| 2018 | $1,683 | $45,500 | $0 | $0 |
| 2017 | $737 | $45,500 | $0 | $0 |
| 2016 | $2,036 | $41,400 | $0 | $0 |
| 2015 | $3,634 | $38,400 | $0 | $0 |
| 2013 | $3,520 | $35,200 | $0 | $0 |
| 2012 | $1,630 | $36,900 | $8,100 | $28,800 |
Source: Public Records
Map
Nearby Homes