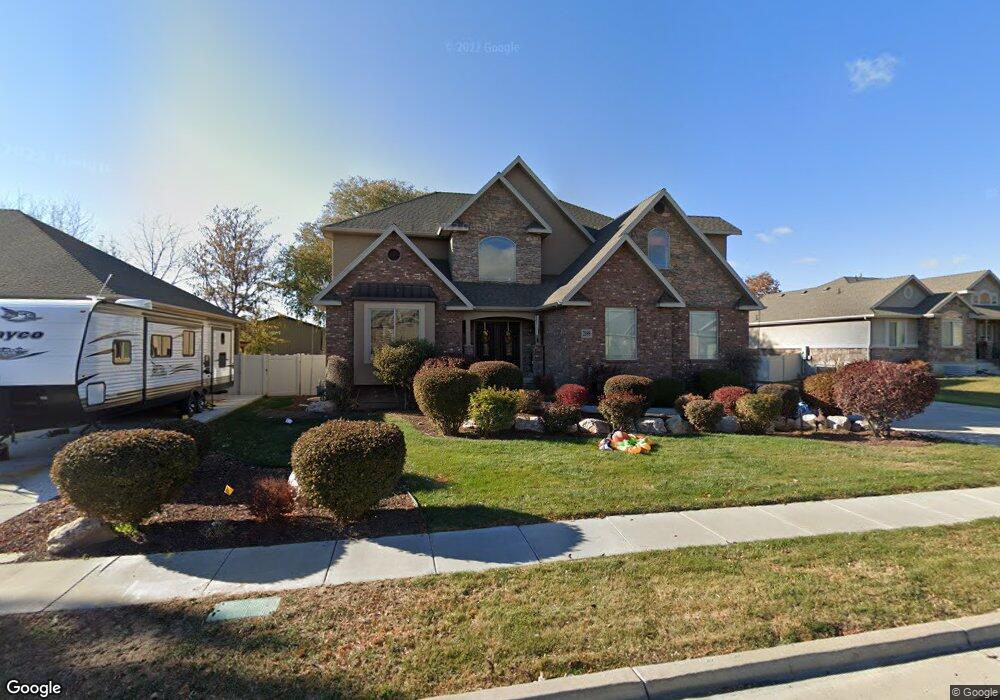
2098 S 550 W Syracuse, UT 84075
Estimated Value: $714,000 - $900,000
7
Beds
4
Baths
4,461
Sq Ft
$183/Sq Ft
Est. Value
About This Home
This home is located at 2098 S 550 W, Syracuse, UT 84075 and is currently estimated at $818,297, approximately $183 per square foot. 2098 S 550 W is a home located in Davis County with nearby schools including Bluff Ridge Elementary, Legacy Junior High School, and Clearfield High School.
Ownership History
Date
Name
Owned For
Owner Type
Purchase Details
Closed on
Jan 31, 2023
Sold by
Vanwormer Shane E
Bought by
Shane And Terry Van Wormer Family Trust
Current Estimated Value
Purchase Details
Closed on
Jun 26, 2008
Sold by
Haines Michael Paul and Haines Kimberly
Bought by
Vanwormer Terry R and Van Wormer Shane E
Home Financials for this Owner
Home Financials are based on the most recent Mortgage that was taken out on this home.
Original Mortgage
$417,000
Interest Rate
5.99%
Mortgage Type
VA
Purchase Details
Closed on
Aug 16, 2005
Sold by
Waynell Investments Co Llc
Bought by
Haines Michael Paul and Haines Kimberly
Home Financials for this Owner
Home Financials are based on the most recent Mortgage that was taken out on this home.
Original Mortgage
$298,400
Interest Rate
5.61%
Mortgage Type
Purchase Money Mortgage
Create a Home Valuation Report for This Property
The Home Valuation Report is an in-depth analysis detailing your home's value as well as a comparison with similar homes in the area
Home Values in the Area
Average Home Value in this Area
Purchase History
| Date | Buyer | Sale Price | Title Company |
|---|---|---|---|
| Shane And Terry Van Wormer Family Trust | -- | -- | |
| Vanwormer Terry R | -- | Bonneville Superior Title Co | |
| Haines Michael Paul | -- | Bonneville Title Company |
Source: Public Records
Mortgage History
| Date | Status | Borrower | Loan Amount |
|---|---|---|---|
| Previous Owner | Vanwormer Terry R | $417,000 | |
| Previous Owner | Haines Michael Paul | $298,400 |
Source: Public Records
Tax History Compared to Growth
Tax History
| Year | Tax Paid | Tax Assessment Tax Assessment Total Assessment is a certain percentage of the fair market value that is determined by local assessors to be the total taxable value of land and additions on the property. | Land | Improvement |
|---|---|---|---|---|
| 2025 | $327 | $448,800 | $127,403 | $321,397 |
| 2024 | $208 | $424,600 | $107,735 | $316,865 |
| 2023 | $167 | $727,000 | $149,979 | $577,021 |
| 2022 | $2,609 | $423,500 | $86,006 | $337,494 |
| 2021 | $1,733 | $561,000 | $127,369 | $433,631 |
| 2020 | $1,331 | $490,000 | $109,762 | $380,238 |
| 2019 | $1,324 | $481,000 | $108,745 | $372,255 |
| 2018 | $1,165 | $450,000 | $104,238 | $345,762 |
| 2016 | $1,449 | $209,550 | $39,955 | $169,595 |
| 2015 | $3,053 | $217,305 | $39,955 | $177,350 |
| 2014 | $1,444 | $204,018 | $39,955 | $164,063 |
| 2013 | -- | $196,425 | $37,902 | $158,523 |
Source: Public Records
Map
Nearby Homes