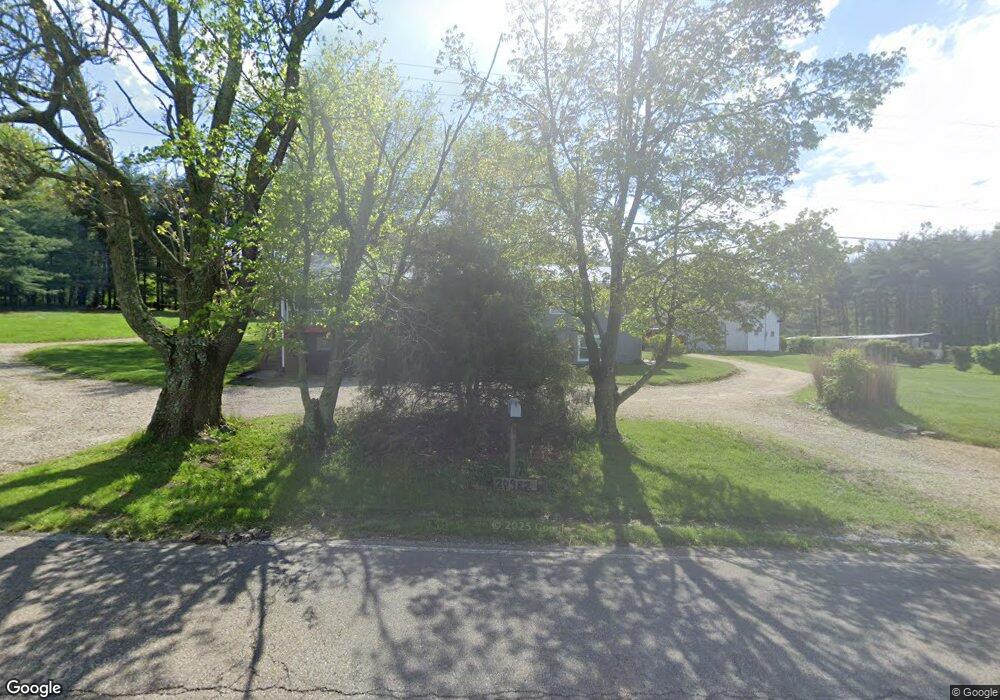
20982 County Road 151 West Lafayette, OH 43845
Estimated Value: $183,400 - $233,000
4
Beds
1
Bath
1,400
Sq Ft
$141/Sq Ft
Est. Value
About This Home
This home is located at 20982 County Road 151, West Lafayette, OH 43845 and is currently estimated at $197,600, approximately $141 per square foot. 20982 County Road 151 is a home located in Coshocton County with nearby schools including Ridgewood Elementary School, Ridgewood Middle School, and Ridgewood High School.
Ownership History
Date
Name
Owned For
Owner Type
Purchase Details
Closed on
Mar 28, 2025
Sold by
Snoots Matthew L
Bought by
Foster Trevor J and Sharier Megan R
Current Estimated Value
Home Financials for this Owner
Home Financials are based on the most recent Mortgage that was taken out on this home.
Original Mortgage
$230,303
Outstanding Balance
$229,323
Interest Rate
6.87%
Mortgage Type
New Conventional
Estimated Equity
-$31,723
Purchase Details
Closed on
Oct 20, 2007
Sold by
Green Thomas S and Green Sandra K
Bought by
Green Darren T
Home Financials for this Owner
Home Financials are based on the most recent Mortgage that was taken out on this home.
Original Mortgage
$72,000
Interest Rate
6.5%
Mortgage Type
Adjustable Rate Mortgage/ARM
Purchase Details
Closed on
Nov 8, 1993
Bought by
Green Thomas S
Create a Home Valuation Report for This Property
The Home Valuation Report is an in-depth analysis detailing your home's value as well as a comparison with similar homes in the area
Home Values in the Area
Average Home Value in this Area
Purchase History
| Date | Buyer | Sale Price | Title Company |
|---|---|---|---|
| Foster Trevor J | $228,000 | None Listed On Document | |
| Foster Trevor J | $228,000 | None Listed On Document | |
| Green Darren T | $72,000 | None Available | |
| Green Thomas S | $35,000 | -- |
Source: Public Records
Mortgage History
| Date | Status | Borrower | Loan Amount |
|---|---|---|---|
| Open | Foster Trevor J | $230,303 | |
| Closed | Foster Trevor J | $230,303 | |
| Previous Owner | Green Darren T | $72,000 |
Source: Public Records
Tax History Compared to Growth
Tax History
| Year | Tax Paid | Tax Assessment Tax Assessment Total Assessment is a certain percentage of the fair market value that is determined by local assessors to be the total taxable value of land and additions on the property. | Land | Improvement |
|---|---|---|---|---|
| 2024 | $1,703 | $44,350 | $9,410 | $34,940 |
| 2023 | $1,703 | $35,994 | $6,580 | $29,414 |
| 2022 | $1,389 | $35,994 | $6,580 | $29,414 |
| 2021 | $1,403 | $35,994 | $6,580 | $29,414 |
| 2020 | $1,312 | $33,856 | $6,594 | $27,262 |
| 2019 | $1,310 | $33,856 | $6,594 | $27,262 |
| 2018 | $1,174 | $33,856 | $6,594 | $27,262 |
| 2017 | $1,088 | $27,875 | $5,877 | $21,998 |
| 2016 | $961 | $27,875 | $5,877 | $21,998 |
| 2015 | $497 | $27,875 | $5,877 | $21,998 |
| 2014 | $857 | $24,039 | $5,877 | $18,162 |
Source: Public Records
Map
Nearby Homes
- 0 State Route 751
- 22112 High St
- 21467 Ohio 751
- 0 Township Road 154 Unit 5125760
- 21083 State Route 751
- 205 E 7th St
- 320 E Union Ave
- Reference# 10 Tr 258
- 204 W Union St
- 0 Cr 143
- 400 N George St
- 324 W Fairview Unit LOT 71
- 528 N George St
- 0 Ohio 751
- 22211 County Road 124
- 57937 Township Road 261
- 57995 County Road 9
- 22399 Township Road 1203
- 203 Main St
- 0 Us-36
- 20940 County Road 151
- 21022 County Road 151
- 20960 County Road 151
- 55008 Township Road 152
- 21034 County Road 151
- 21050 County Road 151
- 20889 County Road 151
- 21120 County Road 151
- 21152 County Road 151
- 20759 County Road 151
- 21185 County Road 151
- 54730 Township Road 152
- 21200 County Road 151
- 20772 County Road 151
- 21190 County Road 151
- 20780 County Road 151
- 54720 Township Road 152
- 21240 County Road 151
- 20699 County Road 151
- 20638 County Road 151