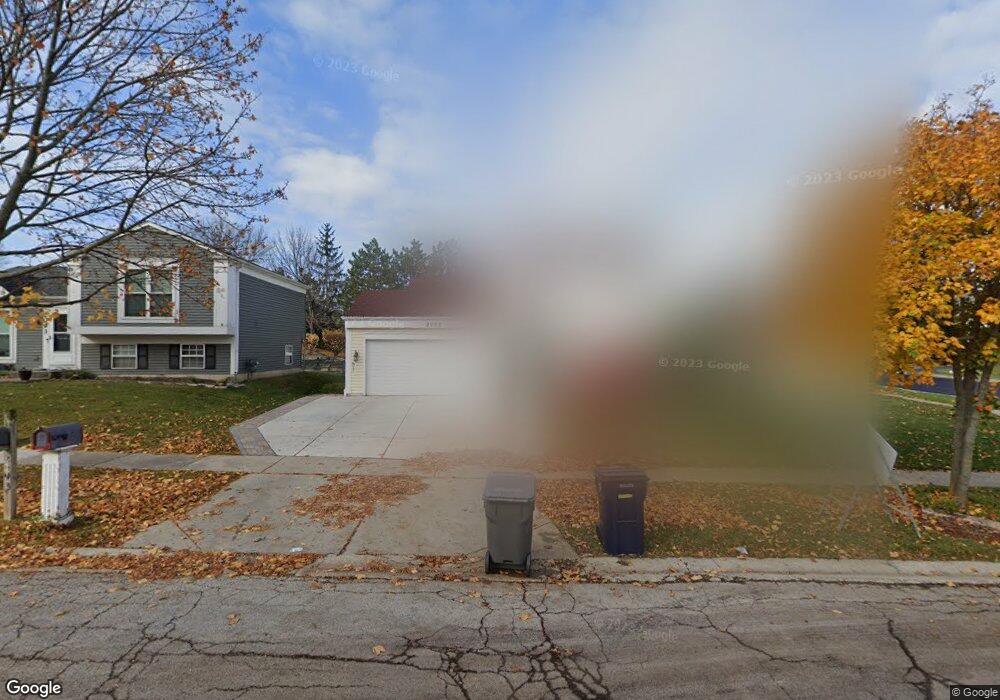
2099 Aronomink Cir Elgin, IL 60123
College Green NeighborhoodEstimated Value: $327,000 - $343,000
3
Beds
2
Baths
1,382
Sq Ft
$243/Sq Ft
Est. Value
About This Home
This home is located at 2099 Aronomink Cir, Elgin, IL 60123 and is currently estimated at $336,448, approximately $243 per square foot. 2099 Aronomink Cir is a home located in Kane County with nearby schools including Otter Creek Elementary School, Abbott Middle School, and South Elgin High School.
Ownership History
Date
Name
Owned For
Owner Type
Purchase Details
Closed on
May 21, 2025
Sold by
Abadines Imelda B
Bought by
Imelda B Abadines Trust and Abadines
Current Estimated Value
Purchase Details
Closed on
Apr 13, 2009
Sold by
Abadines Joseph and Case #05 Dk 1713
Bought by
Abadines Imelda
Purchase Details
Closed on
Feb 21, 1997
Sold by
Abadines Imelda and Empleo Fe Asuncion
Bought by
Abadines Joseph and Abadines Imelda
Home Financials for this Owner
Home Financials are based on the most recent Mortgage that was taken out on this home.
Original Mortgage
$124,900
Interest Rate
7.82%
Purchase Details
Closed on
Apr 28, 1995
Sold by
Martin Jamie T and Martin Barbara S
Bought by
Abadines Imelda B and Empleo Fe Asuncion
Home Financials for this Owner
Home Financials are based on the most recent Mortgage that was taken out on this home.
Original Mortgage
$125,100
Interest Rate
8.43%
Create a Home Valuation Report for This Property
The Home Valuation Report is an in-depth analysis detailing your home's value as well as a comparison with similar homes in the area
Home Values in the Area
Average Home Value in this Area
Purchase History
| Date | Buyer | Sale Price | Title Company |
|---|---|---|---|
| Imelda B Abadines Trust | -- | None Listed On Document | |
| Abadines Imelda | -- | None Available | |
| Abadines Joseph | -- | Ticor Title Insurance | |
| Abadines Imelda B | $132,000 | Chicago Title Insurance Co |
Source: Public Records
Mortgage History
| Date | Status | Borrower | Loan Amount |
|---|---|---|---|
| Previous Owner | Abadines Joseph | $124,900 | |
| Previous Owner | Abadines Imelda B | $125,100 |
Source: Public Records
Tax History
| Year | Tax Paid | Tax Assessment Tax Assessment Total Assessment is a certain percentage of the fair market value that is determined by local assessors to be the total taxable value of land and additions on the property. | Land | Improvement |
|---|---|---|---|---|
| 2024 | $6,630 | $90,844 | $26,129 | $64,715 |
| 2023 | $6,314 | $82,071 | $23,606 | $58,465 |
| 2022 | $5,969 | $74,835 | $21,525 | $53,310 |
| 2021 | $5,707 | $69,965 | $20,124 | $49,841 |
| 2020 | $5,544 | $66,792 | $19,211 | $47,581 |
| 2019 | $5,382 | $63,624 | $18,300 | $45,324 |
| 2018 | $5,141 | $58,002 | $17,240 | $40,762 |
| 2017 | $5,023 | $54,833 | $16,298 | $38,535 |
| 2016 | $4,785 | $50,870 | $15,120 | $35,750 |
| 2015 | -- | $46,627 | $13,859 | $32,768 |
| 2014 | -- | $46,051 | $13,688 | $32,363 |
| 2013 | -- | $47,266 | $14,049 | $33,217 |
Source: Public Records
Map
Nearby Homes
- 1782 Pebble Beach Cir
- 611 Woodbridge Dr
- 1784 College Green Dr
- 1780 College Green Dr Unit 7
- 1705 College Green Dr Unit 2
- 27 Frederick Ct
- 2659 Venetian Ln
- 2156 Sandpiper Way
- 1141 Delta Ct Unit 255E
- 1604 Pebble Beach Cir
- 500 S Randall Rd
- 2350 Camden Bay Unit 176A
- 647 Tuscan View
- 2545 Edgewater Dr
- 1011 Reserve Dr
- 2594 Venetian Ln
- 2595 Venetian Ln
- 304 Nautical Way Unit D
- 10N827 Hawthorne St
- 671 Fieldcrest Dr
- 2093 Aronomink Cir
- 2065 College Green Dr Unit 633F
- 2063 College Green Dr Unit 632B
- 2065 College Green Dr
- 2061 College Green Dr Unit 631
- 2106 Muirfield Cir Unit 8
- 2106 Muirfield Cir Unit 2106
- 2085 Aronomink Cir
- 2098 Aronomink Cir
- 2104 Muirfield Cir Unit 18
- 2094 Aronomink Cir
- 2102 Muirfield Cir
- 2077 College Green Dr Unit 623A
- 2075 College Green Dr Unit 622B
- 2077 College Green Dr Unit 2077
- 2044 College Green Dr
- 2075 Aronomink Cir
- 2073 College Green Dr Unit 621F
- 2090 Aronomink Cir
- 2072 Constitution Ct