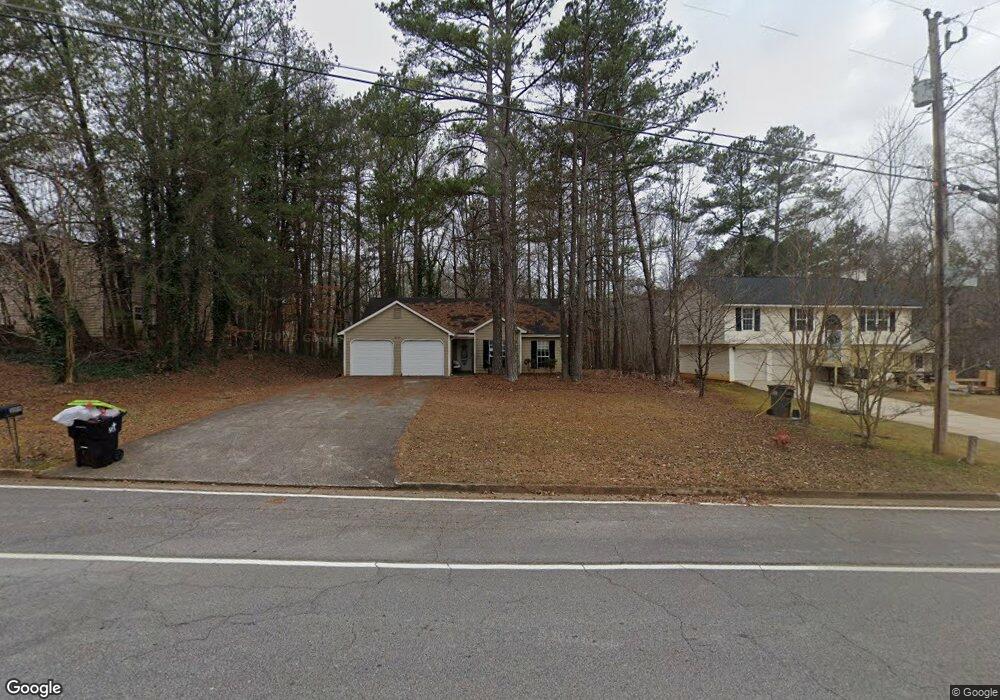
2099 S County Line Rd Lithia Springs, GA 30122
Lithia Springs NeighborhoodEstimated Value: $235,347 - $333,000
3
Beds
2
Baths
1,274
Sq Ft
$218/Sq Ft
Est. Value
About This Home
This home is located at 2099 S County Line Rd, Lithia Springs, GA 30122 and is currently estimated at $277,587, approximately $217 per square foot. 2099 S County Line Rd is a home located in Douglas County with nearby schools including Sweetwater Elementary School, Factory Shoals Middle School, and Lithia Springs Comprehensive High School.
Ownership History
Date
Name
Owned For
Owner Type
Purchase Details
Closed on
Apr 10, 2014
Sold by
Colfin Ai Ga 1 Llc
Bought by
Cah 2014 I Borrower Llc
Current Estimated Value
Purchase Details
Closed on
Aug 7, 2012
Sold by
Hunter Elijah
Bought by
Colfin Ai Ga 1 Llc
Purchase Details
Closed on
Jun 30, 2008
Sold by
Arnold David
Bought by
Hunter Elijah
Home Financials for this Owner
Home Financials are based on the most recent Mortgage that was taken out on this home.
Original Mortgage
$114,900
Interest Rate
5.97%
Mortgage Type
VA
Purchase Details
Closed on
Oct 26, 2007
Sold by
Novastar Mortgage Inc
Bought by
Arnold David
Home Financials for this Owner
Home Financials are based on the most recent Mortgage that was taken out on this home.
Original Mortgage
$86,053
Interest Rate
6.37%
Purchase Details
Closed on
May 1, 2007
Sold by
Parker Rosland D
Bought by
Novastar Mortgage Inc
Create a Home Valuation Report for This Property
The Home Valuation Report is an in-depth analysis detailing your home's value as well as a comparison with similar homes in the area
Home Values in the Area
Average Home Value in this Area
Purchase History
| Date | Buyer | Sale Price | Title Company |
|---|---|---|---|
| Cah 2014 I Borrower Llc | -- | -- | |
| Colfin Ai Ga 1 Llc | $39,660 | -- | |
| Hunter Elijah | $114,900 | -- | |
| Arnold David | $70,000 | -- | |
| Novastar Mortgage Inc | $99,870 | -- |
Source: Public Records
Mortgage History
| Date | Status | Borrower | Loan Amount |
|---|---|---|---|
| Previous Owner | Hunter Elijah | $114,900 | |
| Previous Owner | Arnold David | $86,053 |
Source: Public Records
Tax History Compared to Growth
Tax History
| Year | Tax Paid | Tax Assessment Tax Assessment Total Assessment is a certain percentage of the fair market value that is determined by local assessors to be the total taxable value of land and additions on the property. | Land | Improvement |
|---|---|---|---|---|
| 2024 | $2,349 | $72,600 | $20,328 | $52,272 |
| 2023 | $2,349 | $72,600 | $20,328 | $52,272 |
| 2022 | $2,074 | $72,600 | $20,640 | $51,960 |
| 2021 | $1,595 | $46,920 | $12,480 | $34,440 |
| 2020 | $1,612 | $46,920 | $12,480 | $34,440 |
| 2019 | $1,469 | $45,640 | $12,480 | $33,160 |
| 2018 | $1,261 | $38,720 | $10,800 | $27,920 |
| 2017 | $1,181 | $35,480 | $10,800 | $24,680 |
| 2016 | $1,166 | $34,400 | $10,800 | $23,600 |
| 2015 | $1,239 | $33,720 | $10,800 | $22,920 |
| 2014 | $1,239 | $35,200 | $12,000 | $23,200 |
| 2013 | -- | $34,880 | $12,000 | $22,880 |
Source: Public Records
Map
Nearby Homes
- 3790 Sweetbriar Cir
- HAYDEN Plan at Fairhaven
- GREEN Plan at Fairhaven
- CALI Plan at Fairhaven
- ELLE Plan at Fairhaven
- PENWELL Plan at Fairhaven
- 3948 Fairhaven Rd
- 3924 Fairhaven Rd
- 3940 Fairhaven Rd
- 3686 Sweetbriar Cir
- 3957 Fairhaven Rd
- 3964 Fairhaven Rd
- 3652 Sweetbriar Cir
- 3646 Briar Dr
- 2756 Montie Ct
- 2741 Montie Ct
- 2740 Montie Ct
- 2732 Montie Ct
- 8767 N View Dr
- 3570 Briar Dr
- 2089 S County Line Rd
- 2769 Kerri Place
- 2779 Kerri Place
- 2120 S County Line Rd
- 2750 Kerri Place
- 2130 S County Line Rd
- 2079 S County Line Rd
- 2140 S County Line Rd
- 2760 Kerri Place
- 2732 Brandt Place
- 2768 Melissa Ann Place
- 2129 S County Line Rd
- 2067 Sanders Place
- 2770 Kerri Place
- 2068 Sanders Place
- 2789 Kerri Place
- 2069 S County Line Rd
- 2722 Brandt Place
- 2725 Brandt Place
- 2725 Brandt Place