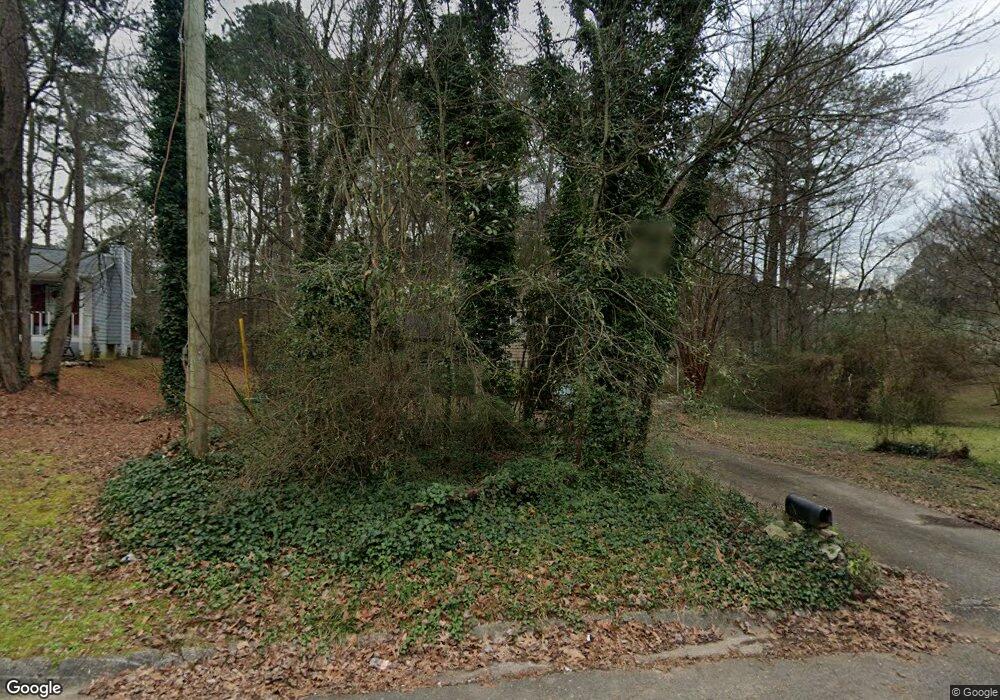
2099 Summertown Dr Unit 1 Norcross, GA 30071
Estimated Value: $355,000 - $375,000
3
Beds
2
Baths
1,244
Sq Ft
$293/Sq Ft
Est. Value
About This Home
This home is located at 2099 Summertown Dr Unit 1, Norcross, GA 30071 and is currently estimated at $364,387, approximately $292 per square foot. 2099 Summertown Dr Unit 1 is a home located in Gwinnett County with nearby schools including Baldwin Elementary, Summerour Middle School, and Paul Duke STEM High School.
Ownership History
Date
Name
Owned For
Owner Type
Purchase Details
Closed on
Nov 23, 2005
Sold by
Jones H Warren
Bought by
Harrell John M
Current Estimated Value
Home Financials for this Owner
Home Financials are based on the most recent Mortgage that was taken out on this home.
Original Mortgage
$111,600
Interest Rate
6.22%
Mortgage Type
New Conventional
Purchase Details
Closed on
Dec 28, 2000
Sold by
Shaffer Cynthia
Bought by
Jones H Warren
Home Financials for this Owner
Home Financials are based on the most recent Mortgage that was taken out on this home.
Original Mortgage
$134,700
Interest Rate
7.75%
Mortgage Type
FHA
Purchase Details
Closed on
Jun 25, 1993
Sold by
Foley Kevin D
Bought by
Willy Bryan L Cynthia
Home Financials for this Owner
Home Financials are based on the most recent Mortgage that was taken out on this home.
Original Mortgage
$77,900
Interest Rate
7.52%
Create a Home Valuation Report for This Property
The Home Valuation Report is an in-depth analysis detailing your home's value as well as a comparison with similar homes in the area
Home Values in the Area
Average Home Value in this Area
Purchase History
| Date | Buyer | Sale Price | Title Company |
|---|---|---|---|
| Harrell John M | $139,500 | -- | |
| Jones H Warren | $135,400 | -- | |
| Willy Bryan L Cynthia | $82,000 | -- |
Source: Public Records
Mortgage History
| Date | Status | Borrower | Loan Amount |
|---|---|---|---|
| Previous Owner | Harrell John M | $111,600 | |
| Previous Owner | Jones H Warren | $134,700 | |
| Previous Owner | Willy Bryan L Cynthia | $77,900 |
Source: Public Records
Tax History Compared to Growth
Tax History
| Year | Tax Paid | Tax Assessment Tax Assessment Total Assessment is a certain percentage of the fair market value that is determined by local assessors to be the total taxable value of land and additions on the property. | Land | Improvement |
|---|---|---|---|---|
| 2025 | $4,736 | $149,880 | $29,440 | $120,440 |
| 2024 | $4,260 | $133,120 | $27,720 | $105,400 |
| 2023 | $4,260 | $133,120 | $27,720 | $105,400 |
| 2022 | $3,822 | $119,080 | $27,720 | $91,360 |
| 2021 | $2,585 | $78,800 | $18,040 | $60,760 |
| 2020 | $2,604 | $78,800 | $18,040 | $60,760 |
| 2019 | $2,679 | $61,160 | $15,240 | $45,920 |
| 2018 | $2,025 | $61,160 | $15,240 | $45,920 |
| 2016 | $1,555 | $47,040 | $10,680 | $36,360 |
| 2015 | $1,657 | $36,640 | $8,680 | $27,960 |
| 2014 | -- | $36,640 | $8,680 | $27,960 |
Source: Public Records
Map
Nearby Homes
- 2199 Summertown Dr
- 5457 Rails Way
- 5381 Station Cir Unit 3
- 5645 Hammond Dr
- 5341 Goodwick Way
- 5477 Windy Creek Ln
- 5479 Windy Creek Ln
- 2009 Hoot Owl Trail
- 26 Reeves St
- 2375 Beaver Falls Dr
- 5364 Hickory Knoll
- 5358 Beaver Branch
- 5357 Beaver Branch
- 5639 Chatham Cir
- 2340 Beaver Ruin Rd Unit 26
- 2340 Beaver Ruin Rd Unit 41
- 2340 Beaver Ruin Rd
- 2340 Beaver Ruin Rd Unit 15
- 2340 Beaver Ruin Rd Unit 16
- 5670 Hollow Ridge Ln
- 2109 Summertown Dr
- 2079 Summertown Dr Unit 1
- 2119 Summertown Dr
- 2059 Summertown Dr
- 0 Summertown Dr Unit 8694652
- 0 Summertown Dr Unit 8240377
- 0 Summertown Dr Unit 8184194
- 0 Summertown Dr
- 2118 Summertown Dr
- 2049 Summertown Dr Unit 1
- 2088 Summertown Dr Unit 1
- 2129 Summertown Dr
- 2078 Summertown Dr
- 2148 Terrace Club Ct
- 2158 Terrace Club Ct
- 2128 Summertown Dr
- 2039 Summertown Dr Unit 1
- 2138 Terrace Club Ct Unit 1
- 2068 Summertown Dr
- 2139 Summertown Dr