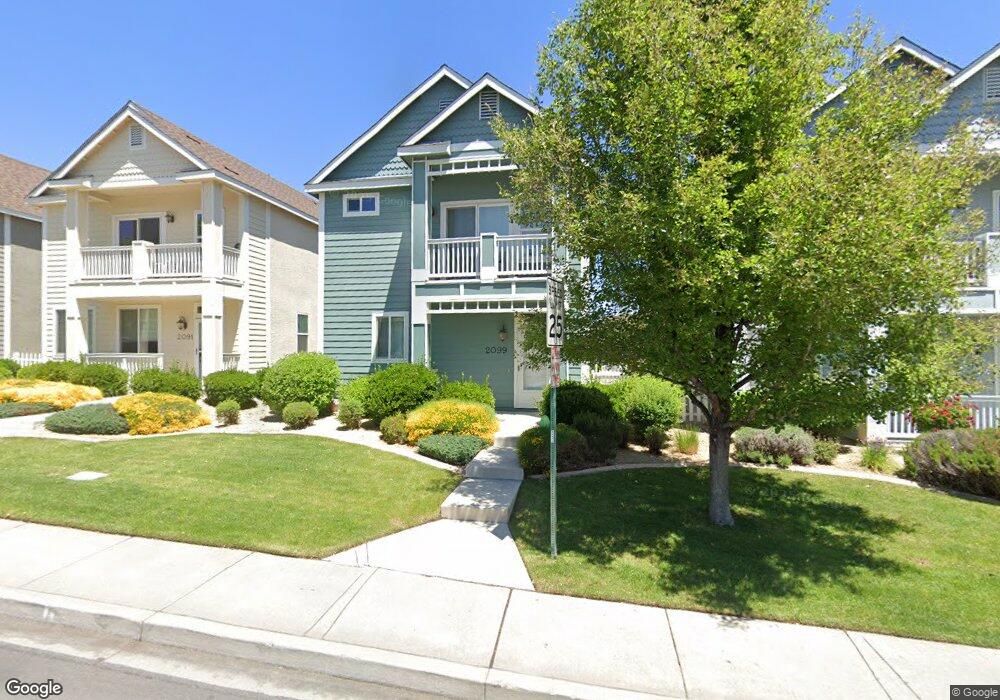
2099 Virginia Lake Way Unit 111 Reno, NV 89509
Virginia Lake NeighborhoodEstimated Value: $512,314 - $630,000
3
Beds
3
Baths
2,293
Sq Ft
$249/Sq Ft
Est. Value
About This Home
This home is located at 2099 Virginia Lake Way Unit 111, Reno, NV 89509 and is currently estimated at $570,579, approximately $248 per square foot. 2099 Virginia Lake Way Unit 111 is a home located in Washoe County with nearby schools including Jessie Beck Elementary School, Darrell C Swope Middle School, and Reno High School.
Ownership History
Date
Name
Owned For
Owner Type
Purchase Details
Closed on
May 28, 2015
Sold by
Irons Robert Dee
Bought by
Namkoong Jae Eun and Ro Joon
Current Estimated Value
Home Financials for this Owner
Home Financials are based on the most recent Mortgage that was taken out on this home.
Original Mortgage
$218,400
Outstanding Balance
$82,399
Interest Rate
3.64%
Mortgage Type
New Conventional
Estimated Equity
$488,180
Purchase Details
Closed on
Dec 5, 2012
Sold by
Virginia Lakes Partners Llc
Bought by
Irons Robert Dee
Home Financials for this Owner
Home Financials are based on the most recent Mortgage that was taken out on this home.
Original Mortgage
$215,943
Interest Rate
3.35%
Mortgage Type
VA
Purchase Details
Closed on
Jul 19, 2011
Sold by
Vlc Investments Llc
Bought by
Capstone Communtiies Llc
Purchase Details
Closed on
Dec 16, 2009
Sold by
Glenmanor At Virginia Lake Crossing Llc
Bought by
Vlc Investments Llc
Create a Home Valuation Report for This Property
The Home Valuation Report is an in-depth analysis detailing your home's value as well as a comparison with similar homes in the area
Home Values in the Area
Average Home Value in this Area
Purchase History
| Date | Buyer | Sale Price | Title Company |
|---|---|---|---|
| Namkoong Jae Eun | $273,000 | Ticor Title Reno Lakeside | |
| Irons Robert Dee | $224,000 | Ticor Title | |
| Capstone Communtiies Llc | $850,000 | Ticor Title Reno | |
| Vlc Investments Llc | $1,060,000 | Ticor Title Reno |
Source: Public Records
Mortgage History
| Date | Status | Borrower | Loan Amount |
|---|---|---|---|
| Open | Namkoong Jae Eun | $218,400 | |
| Previous Owner | Irons Robert Dee | $215,943 |
Source: Public Records
Tax History Compared to Growth
Tax History
| Year | Tax Paid | Tax Assessment Tax Assessment Total Assessment is a certain percentage of the fair market value that is determined by local assessors to be the total taxable value of land and additions on the property. | Land | Improvement |
|---|---|---|---|---|
| 2025 | $3,303 | $115,268 | $35,665 | $79,603 |
| 2024 | $3,303 | $112,546 | $32,795 | $79,751 |
| 2023 | $3,207 | $108,336 | $33,005 | $75,331 |
| 2022 | $3,114 | $90,120 | $27,545 | $62,575 |
| 2021 | $3,022 | $85,332 | $23,310 | $62,022 |
| 2020 | $2,933 | $85,988 | $24,080 | $61,908 |
| 2019 | $2,847 | $82,292 | $22,680 | $59,612 |
| 2018 | $2,765 | $75,451 | $17,395 | $58,056 |
| 2017 | $2,673 | $73,658 | $16,030 | $57,628 |
| 2016 | $2,606 | $72,330 | $13,615 | $58,715 |
| 2015 | $2,601 | $70,957 | $12,285 | $58,672 |
| 2014 | $2,688 | $81,366 | $12,670 | $68,696 |
| 2013 | -- | $71,195 | $11,235 | $59,960 |
Source: Public Records
Map
Nearby Homes
- 2180 Alamo Square Way
- 2040 Alamo Square Way
- 225 Gramercy Ln
- 2020 Alamo Square Way
- 2091 S Virginia St
- 265 Lafayette Ln
- 2265 Grosvenor Park Place
- 230 Glenmanor Dr
- 2450 Lymbery St Unit 228
- 2450 Lymbery St Unit 105
- 2450 Lymbery St Unit 113
- 2450 Lymbery St Unit 107
- 2450 Lymbery St Unit 230
- 2704 Eastshore Place Unit 3
- 421 Glenmanor Dr
- 395 Hillcrest Dr
- 2330 Sunrise Dr
- 43 Ardmore Dr
- 1633 Knox Ave
- 206 Mount Rose St
- 2099 Virginia Lake Way
- 2091 Virginia Lake Way
- 2101 Virginia Lake Way Unit 110
- 2101 Virginia Lake Way
- 2081 Virginia Lake Way
- 2111 Virginia Lake Way Unit 109
- 2111 Virginia Lake Way
- 2090 Virginia Lake Way
- 2071 Virginia Lake Way
- 2080 Virginia Lake Way
- 2121 Virginia Lake Way
- 2070 Virginia Lake Way
- 2061 Virginia Lake Way
- 260 Brenham Ave
- 2060 Virginia Lake Way
- 2120 Virginia Lake Way
- 2051 Virginia Lake Way
- 265 Brenham Ave
- 2141 Virginia Lake Way
- 250 Brenham Ave