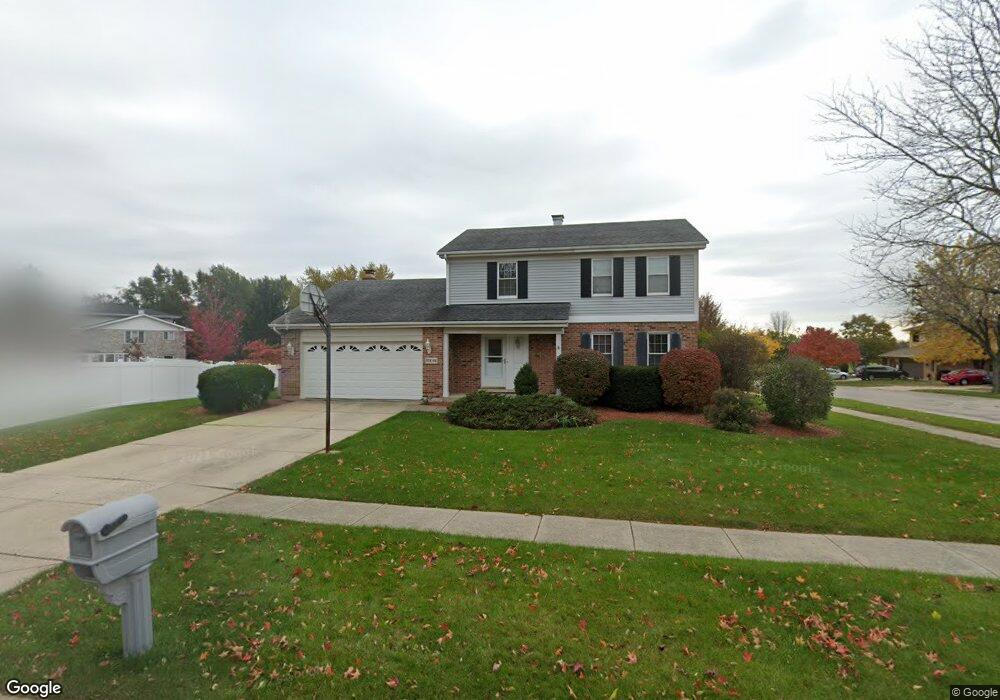
20W441 Peters Ct Downers Grove, IL 60516
South Woodridge NeighborhoodEstimated Value: $491,492 - $568,000
--
Bed
1
Bath
1,769
Sq Ft
$296/Sq Ft
Est. Value
About This Home
This home is located at 20W441 Peters Ct, Downers Grove, IL 60516 and is currently estimated at $524,123, approximately $296 per square foot. 20W441 Peters Ct is a home located in DuPage County with nearby schools including Prairieview Elementary School, Elizabeth Ide Elementary School, and Lakeview Jr High School.
Ownership History
Date
Name
Owned For
Owner Type
Purchase Details
Closed on
Oct 20, 2021
Sold by
Theresa Maloney Trust
Bought by
Maloney Living Trust
Current Estimated Value
Purchase Details
Closed on
Dec 31, 2007
Sold by
Maloney Michael and Maloney Theresa
Bought by
Maloney Theresa and Maloney Michael
Home Financials for this Owner
Home Financials are based on the most recent Mortgage that was taken out on this home.
Original Mortgage
$273,000
Interest Rate
6%
Mortgage Type
New Conventional
Purchase Details
Closed on
Jun 28, 1996
Sold by
Collins Timothy J and Collins Karen Lynne
Bought by
Maloney Michael and Maloney Theresa
Home Financials for this Owner
Home Financials are based on the most recent Mortgage that was taken out on this home.
Original Mortgage
$80,000
Interest Rate
8.07%
Create a Home Valuation Report for This Property
The Home Valuation Report is an in-depth analysis detailing your home's value as well as a comparison with similar homes in the area
Home Values in the Area
Average Home Value in this Area
Purchase History
| Date | Buyer | Sale Price | Title Company |
|---|---|---|---|
| Maloney Living Trust | -- | Dalton & Dalton Pc | |
| Maloney Theresa | -- | Attorney | |
| Maloney Theresa | -- | None Available | |
| Maloney Michael | $190,000 | -- |
Source: Public Records
Mortgage History
| Date | Status | Borrower | Loan Amount |
|---|---|---|---|
| Previous Owner | Maloney Theresa | $273,000 | |
| Previous Owner | Maloney Michael | $80,000 |
Source: Public Records
Tax History Compared to Growth
Tax History
| Year | Tax Paid | Tax Assessment Tax Assessment Total Assessment is a certain percentage of the fair market value that is determined by local assessors to be the total taxable value of land and additions on the property. | Land | Improvement |
|---|---|---|---|---|
| 2024 | $8,253 | $154,533 | $69,837 | $84,696 |
| 2023 | $7,909 | $142,060 | $64,200 | $77,860 |
| 2022 | $7,496 | $134,620 | $61,680 | $72,940 |
| 2021 | $6,841 | $133,090 | $60,980 | $72,110 |
| 2020 | $6,721 | $130,450 | $59,770 | $70,680 |
| 2019 | $6,493 | $125,170 | $57,350 | $67,820 |
| 2018 | $6,199 | $117,570 | $56,920 | $60,650 |
| 2017 | $5,961 | $113,130 | $54,770 | $58,360 |
| 2016 | $6,435 | $121,890 | $52,270 | $69,620 |
| 2015 | $6,343 | $114,680 | $49,180 | $65,500 |
| 2014 | $6,232 | $111,500 | $47,820 | $63,680 |
| 2013 | $6,335 | $110,980 | $47,600 | $63,380 |
Source: Public Records
Map
Nearby Homes
- 10S241 Wallace Dr
- 8843 Oxford St
- 3145 Hillside Ln
- 8551 Sperry Ct
- 8498 Cornelia Ln
- Danbury II Plan at The Townes at Farmingdale
- Brighton Plan at The Townes at Farmingdale
- Braeden Plan at The Townes at Farmingdale
- Campbell Plan at The Townes at Farmingdale
- 8497 Liberty Ln
- 1850 Fulton St
- 1846 Fulton St
- 8538 Sperry Ct
- 1858 Fulton St
- 8537 Chadwick Ct
- 8530 Sperry Ct
- 8541 Chadwick Ct
- 1886 Fulton St
- 8542 Sperry Ct
- 1854 Fulton St
- 20W425 Peters Ct
- 10S275 Havens Dr
- 20W415 Peters Ct
- 20W440 Peters Ct
- 10S270 Havens Dr
- 10S250 Havens Dr
- 10S285 Havens Dr
- 20W418 Peters Ct
- 20W430 Peters Ct
- 10S240 Havens Dr
- 10S280 Havens Dr
- 10S230 Havens Dr Unit 8
- 20W405 Peters Ct
- 20W406 Peters Ct
- 10S306 Havens Dr
- 10S251 Wallace Dr
- 10S261 Wallace Dr
- 10S220 Havens Dr
- 20W431 Rooke Ct
- 10S271 Wallace Dr