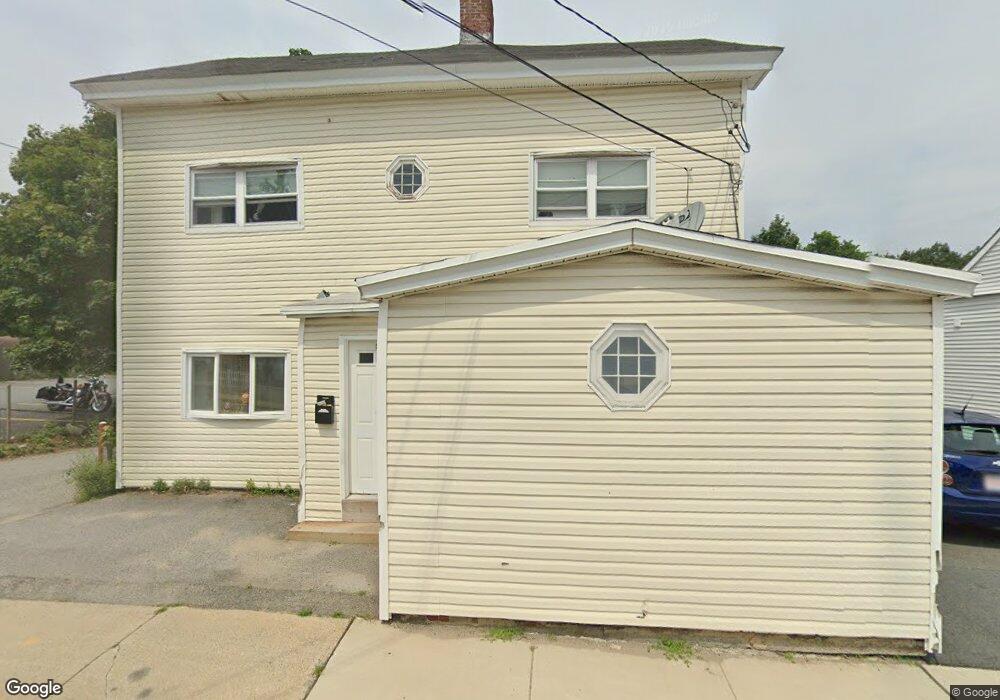
21 1/2 Pelham St Methuen, MA 01844
Downtown Methuen NeighborhoodEstimated Value: $337,000 - $452,091
3
Beds
1
Bath
1,020
Sq Ft
$393/Sq Ft
Est. Value
About This Home
This home is located at 21 1/2 Pelham St, Methuen, MA 01844 and is currently estimated at $401,364, approximately $393 per square foot. 21 1/2 Pelham St is a home located in Essex County with nearby schools including Marsh Grammar School, South Point Elementary School, and Methuen High School.
Ownership History
Date
Name
Owned For
Owner Type
Purchase Details
Closed on
Mar 19, 2025
Sold by
Anaa Realty Llc
Bought by
Ybonis Property Group Llc
Current Estimated Value
Home Financials for this Owner
Home Financials are based on the most recent Mortgage that was taken out on this home.
Original Mortgage
$264,000
Outstanding Balance
$262,195
Interest Rate
6.89%
Mortgage Type
Commercial
Estimated Equity
$139,169
Create a Home Valuation Report for This Property
The Home Valuation Report is an in-depth analysis detailing your home's value as well as a comparison with similar homes in the area
Home Values in the Area
Average Home Value in this Area
Purchase History
| Date | Buyer | Sale Price | Title Company |
|---|---|---|---|
| Ybonis Property Group Llc | $330,000 | None Available | |
| Ybonis Property Group Llc | $330,000 | None Available |
Source: Public Records
Mortgage History
| Date | Status | Borrower | Loan Amount |
|---|---|---|---|
| Open | Ybonis Property Group Llc | $264,000 | |
| Closed | Ybonis Property Group Llc | $264,000 |
Source: Public Records
Tax History Compared to Growth
Tax History
| Year | Tax Paid | Tax Assessment Tax Assessment Total Assessment is a certain percentage of the fair market value that is determined by local assessors to be the total taxable value of land and additions on the property. | Land | Improvement |
|---|---|---|---|---|
| 2025 | $3,677 | $347,500 | $180,800 | $166,700 |
| 2024 | $3,447 | $317,400 | $150,700 | $166,700 |
| 2023 | $3,490 | $298,300 | $150,700 | $147,600 |
| 2022 | $3,384 | $259,300 | $123,300 | $136,000 |
| 2021 | $3,203 | $242,800 | $116,500 | $126,300 |
| 2020 | $3,134 | $233,200 | $116,500 | $116,700 |
| 2019 | $2,915 | $205,400 | $109,600 | $95,800 |
| 2018 | $2,738 | $191,900 | $102,800 | $89,100 |
| 2017 | $2,685 | $183,300 | $102,800 | $80,500 |
| 2016 | $2,454 | $165,700 | $89,100 | $76,600 |
| 2015 | $2,416 | $165,500 | $89,100 | $76,400 |
Source: Public Records
Map
Nearby Homes
- 47 Lowell St
- 83 Arnold St
- 26 Gage St
- 52 High St Unit 5
- 20-22 Ashland Ave
- 24 Railroad St
- 190-192 Oakland Ave
- 2 Horne St
- 35 Hardy St
- 17-19 Maplewood Ave
- 37 Maplewood Ave
- 100-102 Phillips St
- 23 Chase St
- 69 Broadway
- 18 Larchwood Rd
- 48 Larchwood Rd
- 35 Stillwater Rd
- 206-208 Willow St
- 2 Lawrence St
- 82 Oakside Ave
- 27 Pelham St
- 29 Pelham St
- 31 Pelham St Unit 31
- 5 Pelham St
- 7 Pelham St
- 33 Pelham St
- 30 Pelham St
- 37 Lowell St
- 36-38 Pelham St
- 23 Lowell St
- 23 Lowell St Unit 2R
- 23 Lowell St Unit A
- 36 Pelham St Unit 38
- 114 Railroad St Unit 122
- 114 Railroad St
- 5 Pelham Ave Unit 1
- 5 Pelham Ave Unit 3
- 5 Pelham Ave
- 35 Pelham Ave
- 3-5 Pelham Ave