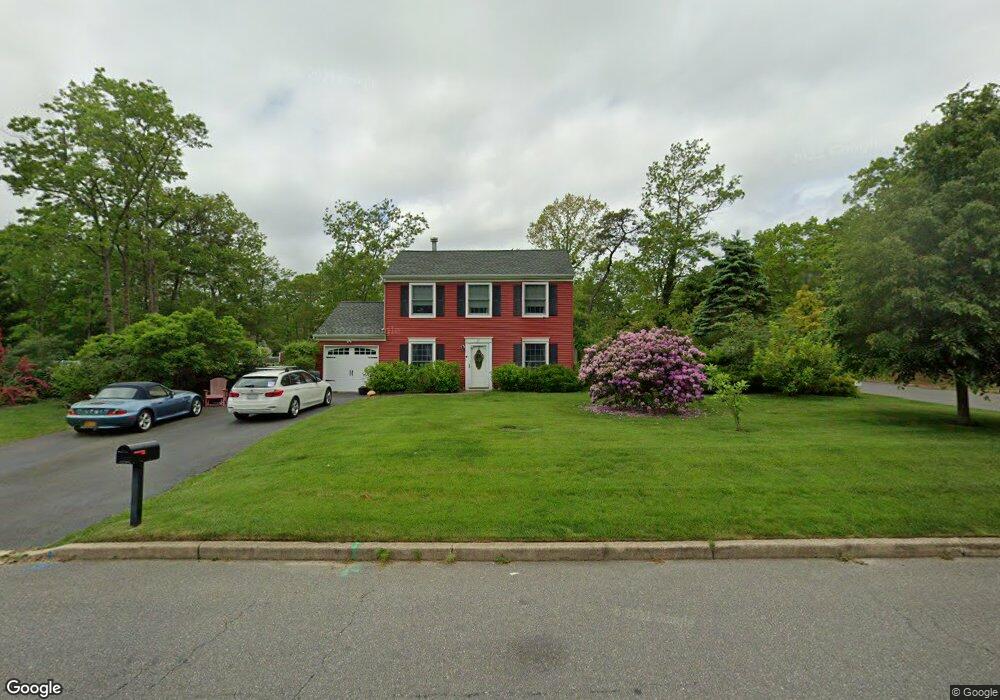
21 1st St Barnegat, NJ 08005
Barnegat Township NeighborhoodEstimated Value: $367,283 - $478,000
3
Beds
3
Baths
1,448
Sq Ft
$296/Sq Ft
Est. Value
About This Home
This home is located at 21 1st St, Barnegat, NJ 08005 and is currently estimated at $428,821, approximately $296 per square foot. 21 1st St is a home located in Ocean County with nearby schools including Barnegat High School.
Ownership History
Date
Name
Owned For
Owner Type
Purchase Details
Closed on
May 25, 2005
Current Estimated Value
Home Financials for this Owner
Home Financials are based on the most recent Mortgage that was taken out on this home.
Original Mortgage
$294,500
Outstanding Balance
$153,061
Interest Rate
5.79%
Mortgage Type
Fannie Mae Freddie Mac
Estimated Equity
$275,760
Purchase Details
Closed on
Oct 28, 1997
Sold by
Hud
Bought by
Furmanek John J and Furmanek Annette F
Home Financials for this Owner
Home Financials are based on the most recent Mortgage that was taken out on this home.
Original Mortgage
$74,480
Interest Rate
7.23%
Create a Home Valuation Report for This Property
The Home Valuation Report is an in-depth analysis detailing your home's value as well as a comparison with similar homes in the area
Home Values in the Area
Average Home Value in this Area
Purchase History
| Date | Buyer | Sale Price | Title Company |
|---|---|---|---|
| -- | $310,000 | -- | |
| Furmanek John J | $78,401 | -- |
Source: Public Records
Mortgage History
| Date | Status | Borrower | Loan Amount |
|---|---|---|---|
| Open | -- | $294,500 | |
| Previous Owner | Furmanek John J | $74,480 |
Source: Public Records
Tax History Compared to Growth
Tax History
| Year | Tax Paid | Tax Assessment Tax Assessment Total Assessment is a certain percentage of the fair market value that is determined by local assessors to be the total taxable value of land and additions on the property. | Land | Improvement |
|---|---|---|---|---|
| 2025 | $6,284 | $211,100 | $106,500 | $104,600 |
| 2024 | $6,145 | $211,100 | $106,500 | $104,600 |
| 2023 | $5,947 | $211,100 | $106,500 | $104,600 |
| 2022 | $5,947 | $211,100 | $106,500 | $104,600 |
| 2021 | $5,919 | $211,100 | $106,500 | $104,600 |
| 2020 | $5,892 | $211,100 | $106,500 | $104,600 |
| 2019 | $5,805 | $211,100 | $106,500 | $104,600 |
| 2018 | $5,761 | $211,100 | $106,500 | $104,600 |
| 2017 | $5,666 | $211,100 | $106,500 | $104,600 |
| 2016 | $5,550 | $211,100 | $106,500 | $104,600 |
| 2015 | $5,375 | $211,100 | $106,500 | $104,600 |
| 2014 | $5,237 | $211,100 | $106,500 | $104,600 |
Source: Public Records
Map
Nearby Homes
- 14 Ridge Rd
- 32 1st St
- 91 Highland Dr
- 9 Glen Ct
- 28 Pond View Cir
- 24 Pond View Cir
- 66 Butler Dr
- 89 Ravenwood Blvd
- 4 Quail Rd
- 107 Spruce Cir N
- 15 Shady Stream Rd
- 18 Valley Stream Place
- 7 Old Mill Ct
- 61 Sandpiper Rd
- 98 Mirage Blvd
- 80 Robin Ln
- 78 Mirage Blvd
- 21 Butler Dr
- 750 Lighthouse Dr Unit 3313
- 750 Lighthouse Dr Unit 3201