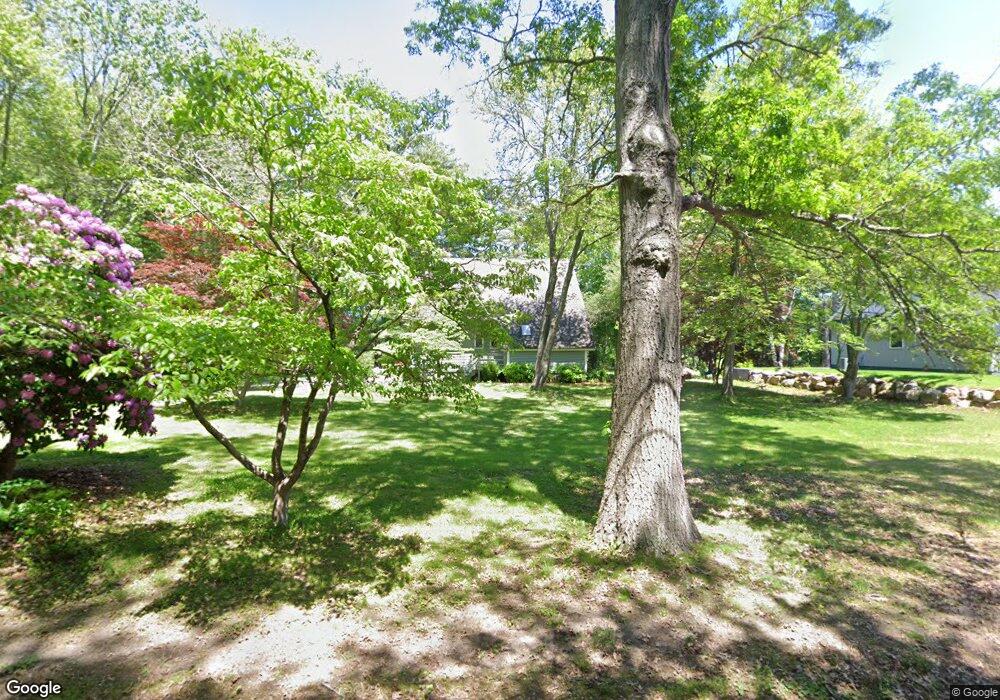
21 & 23 Hiscox Rd Westerly, RI 02891
Estimated Value: $530,429 - $651,000
3
Beds
3
Baths
1,546
Sq Ft
$376/Sq Ft
Est. Value
About This Home
This home is located at 21 & 23 Hiscox Rd, Westerly, RI 02891 and is currently estimated at $581,357, approximately $376 per square foot. 21 & 23 Hiscox Rd is a home located in Washington County with nearby schools including Westerly High School and St. Michael School.
Ownership History
Date
Name
Owned For
Owner Type
Purchase Details
Closed on
Jun 20, 2019
Sold by
Gingerella Teresa M Est
Bought by
Barber William C and Odonnell Lauren M
Current Estimated Value
Home Financials for this Owner
Home Financials are based on the most recent Mortgage that was taken out on this home.
Original Mortgage
$256,000
Outstanding Balance
$225,087
Interest Rate
4.1%
Mortgage Type
Purchase Money Mortgage
Estimated Equity
$356,270
Create a Home Valuation Report for This Property
The Home Valuation Report is an in-depth analysis detailing your home's value as well as a comparison with similar homes in the area
Home Values in the Area
Average Home Value in this Area
Purchase History
| Date | Buyer | Sale Price | Title Company |
|---|---|---|---|
| Barber William C | $320,000 | -- |
Source: Public Records
Mortgage History
| Date | Status | Borrower | Loan Amount |
|---|---|---|---|
| Open | Barber William C | $256,000 |
Source: Public Records
Tax History Compared to Growth
Tax History
| Year | Tax Paid | Tax Assessment Tax Assessment Total Assessment is a certain percentage of the fair market value that is determined by local assessors to be the total taxable value of land and additions on the property. | Land | Improvement |
|---|---|---|---|---|
| 2025 | $3,784 | $532,200 | $270,600 | $261,600 |
| 2024 | $3,720 | $379,200 | $193,700 | $185,500 |
| 2023 | $3,648 | $379,200 | $193,700 | $185,500 |
| 2022 | $3,625 | $379,200 | $193,700 | $185,500 |
| 2021 | $3,632 | $315,300 | $168,600 | $146,700 |
| 2020 | $3,566 | $315,300 | $168,600 | $146,700 |
| 2019 | $3,501 | $312,600 | $168,600 | $144,000 |
| 2018 | $3,505 | $295,000 | $168,600 | $126,400 |
| 2017 | $3,419 | $295,000 | $168,600 | $126,400 |
| 2016 | $3,446 | $295,000 | $168,600 | $126,400 |
| 2015 | $3,346 | $309,200 | $179,700 | $129,500 |
| 2014 | $3,290 | $309,200 | $179,700 | $129,500 |
Source: Public Records
Map
Nearby Homes