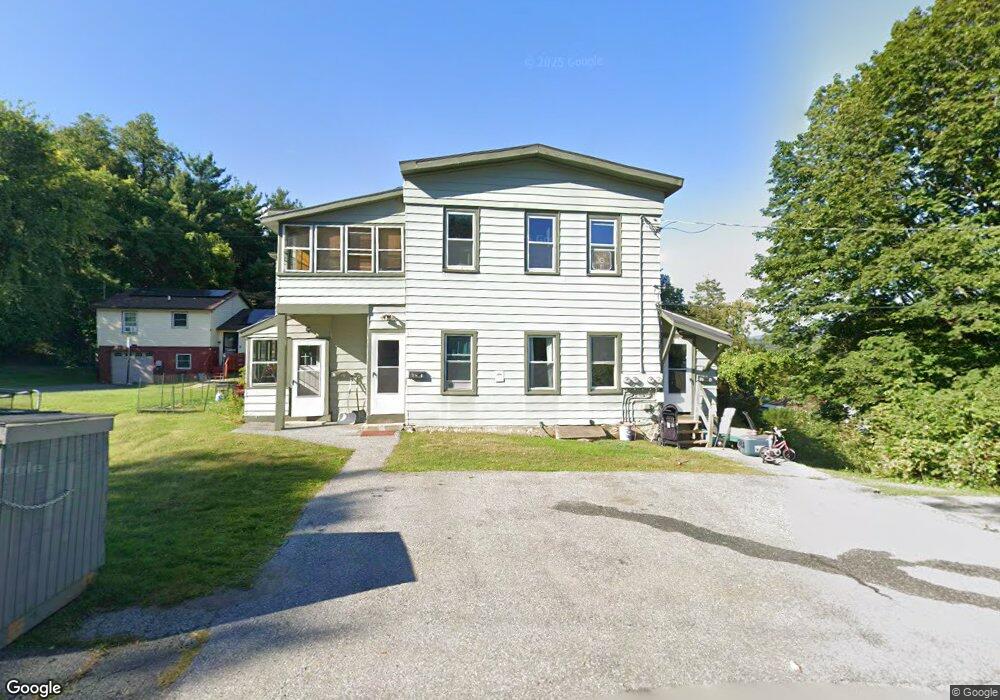
21-23 Lyman St North Adams, MA 01247
Estimated Value: $198,000 - $241,000
1
Bed
1
Bath
750
Sq Ft
$294/Sq Ft
Est. Value
About This Home
This home is located at 21-23 Lyman St, North Adams, MA 01247 and is currently estimated at $220,137, approximately $293 per square foot. 21-23 Lyman St is a home located in Berkshire County with nearby schools including Brayton Elementary School, Drury High School, and St. Stanislaus Kostka School.
Ownership History
Date
Name
Owned For
Owner Type
Purchase Details
Closed on
May 11, 2007
Sold by
Gaffey Matthew J
Bought by
Furey Luke H
Current Estimated Value
Home Financials for this Owner
Home Financials are based on the most recent Mortgage that was taken out on this home.
Original Mortgage
$146,205
Interest Rate
6.21%
Mortgage Type
Purchase Money Mortgage
Purchase Details
Closed on
Nov 16, 1999
Sold by
Cozzaglio Joseph
Bought by
Peltier Jeffrey C and Gaffey Matthew J
Home Financials for this Owner
Home Financials are based on the most recent Mortgage that was taken out on this home.
Original Mortgage
$76,000
Interest Rate
7.68%
Mortgage Type
Purchase Money Mortgage
Create a Home Valuation Report for This Property
The Home Valuation Report is an in-depth analysis detailing your home's value as well as a comparison with similar homes in the area
Home Values in the Area
Average Home Value in this Area
Purchase History
| Date | Buyer | Sale Price | Title Company |
|---|---|---|---|
| Furey Luke H | $148,500 | -- | |
| Furey Luke H | $148,500 | -- | |
| Peltier Jeffrey C | $100,000 | -- | |
| Peltier Jeffrey C | $100,000 | -- |
Source: Public Records
Mortgage History
| Date | Status | Borrower | Loan Amount |
|---|---|---|---|
| Open | Peltier Jeffrey C | $134,199 | |
| Closed | Furey Luke H | $146,205 | |
| Previous Owner | Peltier Jeffrey C | $76,000 |
Source: Public Records
Tax History Compared to Growth
Tax History
| Year | Tax Paid | Tax Assessment Tax Assessment Total Assessment is a certain percentage of the fair market value that is determined by local assessors to be the total taxable value of land and additions on the property. | Land | Improvement |
|---|---|---|---|---|
| 2025 | $3,407 | $203,900 | $33,600 | $170,300 |
| 2024 | $3,198 | $186,600 | $30,700 | $155,900 |
| 2023 | $2,792 | $158,000 | $30,700 | $127,300 |
| 2022 | $2,928 | $158,000 | $30,700 | $127,300 |
| 2021 | $2,721 | $146,200 | $28,400 | $117,800 |
| 2020 | $2,685 | $144,200 | $27,100 | $117,100 |
| 2019 | $2,687 | $140,600 | $27,700 | $112,900 |
| 2018 | $2,540 | $143,900 | $29,700 | $114,200 |
| 2017 | $2,520 | $142,600 | $29,500 | $113,100 |
| 2016 | $2,480 | $142,600 | $29,500 | $113,100 |
| 2015 | $2,397 | $143,600 | $30,500 | $113,100 |
Source: Public Records
Map
Nearby Homes
- 336 Walnut St
- 297 Walnut St
- 33 Gattuso Dr
- 85 Furnace St
- 11-15 Perry St
- 74 Washington Ave
- 388 Ashland St Unit 1
- 16 Forrest St
- 0 Ashland St Unit 245228
- 0 Church St
- 209 Corinth St
- 86 W Main St
- 194 E Main St
- 31 Dover St
- 30 Dover St
- 19 N Church St Unit 11
- 19 N Church St Unit 14
- 19 N Church St Unit 12
- 19 N Church St Unit 7
- 26 Charles St