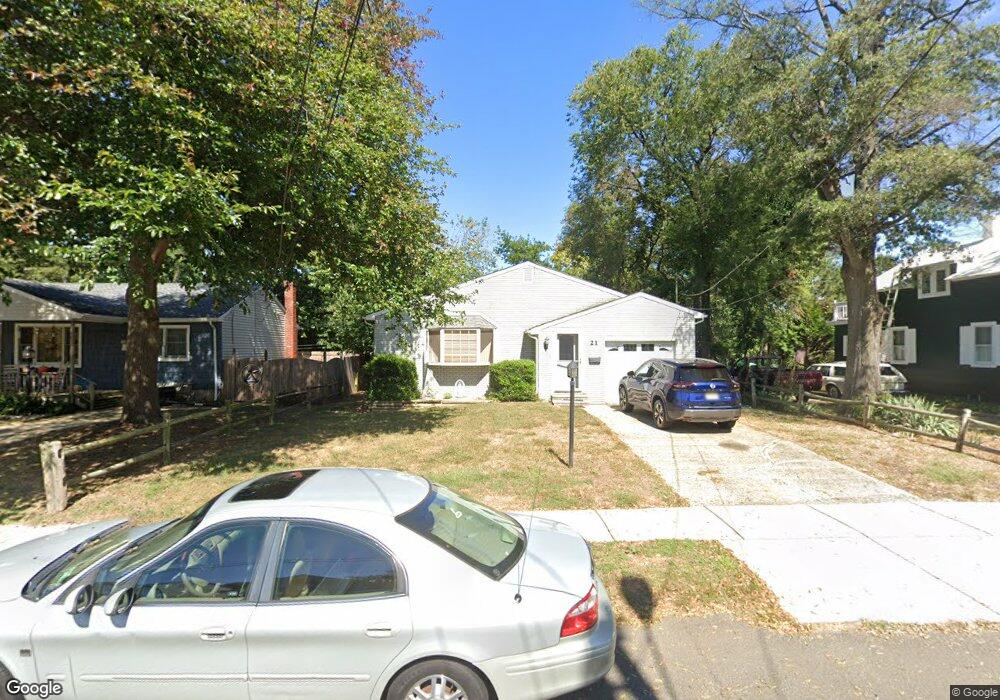
21 2nd St Keansburg, NJ 07734
Estimated Value: $419,000 - $482,000
3
Beds
1
Bath
1,104
Sq Ft
$406/Sq Ft
Est. Value
About This Home
This home is located at 21 2nd St, Keansburg, NJ 07734 and is currently estimated at $448,433, approximately $406 per square foot. 21 2nd St is a home located in Monmouth County with nearby schools including Raritan High School, Baytul-Iman Academy, and St. Ann School.
Ownership History
Date
Name
Owned For
Owner Type
Purchase Details
Closed on
May 13, 2022
Sold by
Thomas Calhoun Ronald and Thomas Patti A
Bought by
Calhoun Ronald Thomas and Calhoun Patti A
Current Estimated Value
Home Financials for this Owner
Home Financials are based on the most recent Mortgage that was taken out on this home.
Original Mortgage
$200,000
Outstanding Balance
$165,083
Interest Rate
3.91%
Mortgage Type
New Conventional
Estimated Equity
$283,350
Purchase Details
Closed on
Aug 10, 1988
Bought by
Calhoun Ronald T
Create a Home Valuation Report for This Property
The Home Valuation Report is an in-depth analysis detailing your home's value as well as a comparison with similar homes in the area
Home Values in the Area
Average Home Value in this Area
Purchase History
| Date | Buyer | Sale Price | Title Company |
|---|---|---|---|
| Calhoun Ronald Thomas | $73,004 | Hale Leila H | |
| Calhoun Ronald Thomas | $73,004 | Hale Leila H | |
| Calhoun Ronald T | $137,000 | -- |
Source: Public Records
Mortgage History
| Date | Status | Borrower | Loan Amount |
|---|---|---|---|
| Open | Calhoun Ronald Thomas | $200,000 | |
| Closed | Calhoun Ronald Thomas | $200,000 |
Source: Public Records
Tax History Compared to Growth
Tax History
| Year | Tax Paid | Tax Assessment Tax Assessment Total Assessment is a certain percentage of the fair market value that is determined by local assessors to be the total taxable value of land and additions on the property. | Land | Improvement |
|---|---|---|---|---|
| 2025 | $7,550 | $395,800 | $250,000 | $145,800 |
| 2024 | $7,409 | $359,000 | $216,000 | $143,000 |
| 2023 | $7,409 | $346,700 | $205,000 | $141,700 |
| 2022 | $6,746 | $288,300 | $163,500 | $124,800 |
| 2021 | $6,746 | $263,000 | $152,000 | $111,000 |
| 2020 | $6,623 | $256,500 | $148,000 | $108,500 |
| 2019 | $6,369 | $242,800 | $135,000 | $107,800 |
| 2018 | $6,158 | $232,800 | $130,000 | $102,800 |
| 2017 | $5,753 | $217,500 | $121,700 | $95,800 |
| 2016 | $5,818 | $220,800 | $121,700 | $99,100 |
| 2015 | $5,734 | $218,200 | $121,700 | $96,500 |
| 2014 | $5,416 | $193,300 | $100,000 | $93,300 |
Source: Public Records
Map
Nearby Homes