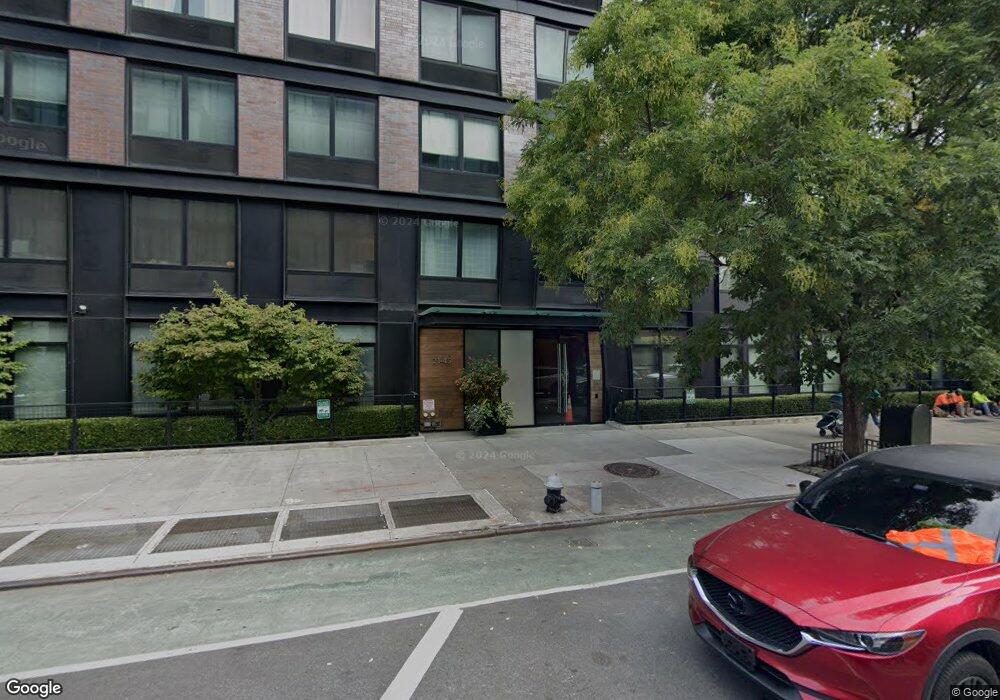
The Industry 21-45 44th Dr Unit 2D Long Island City, NY 11101
Long Island City NeighborhoodEstimated Value: $1,348,980 - $1,752,000
2
Beds
2
Baths
1,108
Sq Ft
$1,350/Sq Ft
Est. Value
About This Home
This home is located at 21-45 44th Dr Unit 2D, Long Island City, NY 11101 and is currently estimated at $1,495,995, approximately $1,350 per square foot. 21-45 44th Dr Unit 2D is a home located in Queens County with nearby schools including P.S./I.S. 78Q Early Childhood Center, I.S. 204 Oliver W. Holmes, and Long Island City High School.
Ownership History
Date
Name
Owned For
Owner Type
Purchase Details
Closed on
Dec 27, 2018
Sold by
Goldstein Edward and Tr Shirokane 501
Bought by
Goldstein Abbey and Goldstein Claire
Current Estimated Value
Purchase Details
Closed on
Dec 28, 2016
Sold by
Broadwater Kimberly and Broadwater Noah
Bought by
Goldstein Edward and Yamaguchi Saori
Home Financials for this Owner
Home Financials are based on the most recent Mortgage that was taken out on this home.
Original Mortgage
$375,000
Interest Rate
4.08%
Mortgage Type
Unknown
Purchase Details
Closed on
Jul 30, 2012
Sold by
21-45 44Th Drive Llc
Bought by
Broadwater Kimberly and Broadwater Noah
Home Financials for this Owner
Home Financials are based on the most recent Mortgage that was taken out on this home.
Original Mortgage
$600,000
Interest Rate
3.7%
Mortgage Type
New Conventional
Create a Home Valuation Report for This Property
The Home Valuation Report is an in-depth analysis detailing your home's value as well as a comparison with similar homes in the area
Home Values in the Area
Average Home Value in this Area
Purchase History
| Date | Buyer | Sale Price | Title Company |
|---|---|---|---|
| Goldstein Abbey | $1,300,000 | -- | |
| Goldstein Edward | $1,140,442 | -- | |
| Broadwater Kimberly | $750,000 | -- |
Source: Public Records
Mortgage History
| Date | Status | Borrower | Loan Amount |
|---|---|---|---|
| Previous Owner | Goldstein Edward | $375,000 | |
| Previous Owner | Goldstein Edward | $375,000 | |
| Previous Owner | Broadwater Kimberly | $600,000 |
Source: Public Records
Tax History Compared to Growth
Tax History
| Year | Tax Paid | Tax Assessment Tax Assessment Total Assessment is a certain percentage of the fair market value that is determined by local assessors to be the total taxable value of land and additions on the property. | Land | Improvement |
|---|---|---|---|---|
| 2025 | $8,729 | $114,857 | $5,237 | $109,620 |
| 2024 | $8,729 | $114,217 | $5,237 | $108,980 |
| 2023 | $5,953 | $114,210 | $5,237 | $108,973 |
| 2022 | $3,097 | $113,744 | $5,237 | $108,507 |
| 2021 | $395 | $113,548 | $5,237 | $108,311 |
| 2020 | $401 | $126,965 | $5,237 | $121,728 |
| 2019 | $406 | $128,019 | $5,237 | $122,782 |
| 2018 | $409 | $108,813 | $5,236 | $103,577 |
| 2017 | $409 | $104,287 | $6,542 | $97,745 |
| 2016 | $415 | $104,287 | $6,542 | $97,745 |
| 2015 | $324 | $100,676 | $9,148 | $91,528 |
| 2014 | $324 | $99,161 | $9,338 | $89,823 |
Source: Public Records
About The Industry
Map
Nearby Homes
- 21-30 44th Dr Unit 5-A
- 21-30 44th Dr Unit 5-H
- 21-30 44th Dr Unit 6-I
- 21-30 44th Dr Unit 6-A
- 21-30 44th Dr Unit 7-H
- 21-30 44th Dr Unit 6-J
- 21-45 44th Dr Unit 4I
- 21-45 44th Dr Unit 6-B
- 21-10 44th Dr
- 21-10 44th Dr Unit PHA
- 2110 44th Dr Unit 2B
- 45-10 23rd St
- 11-52 44th Dr Unit 7-A
- 11-52 44th Dr Unit 3-D
- 11-52 44th Dr Unit A-2
- 11-52 44th Dr Unit 4-B
- 11-52 44th Dr Unit 2-C
- 11-52 44th Dr Unit 4-A
- 11-52 44th Dr Unit 2-D
- 11-52 44th Dr Unit 6-D
- 21-45 44th Dr Unit 5G
- 21-45 44th Dr Unit 6J
- 21-45 44th Dr Unit 4-C
- 21-45 44th Dr Unit 6 I
- 21-45 44th Dr Unit 4 E
- 21-45 44th Dr Unit 4-G
- 21-45 44th Dr
- 21-45 44th Dr Unit 1
- 21-45 44th Dr Unit 3-F
- 21-45 44th Dr Unit 5-K
- 21-45 44th Dr Unit 3K
- 21-45 44th Dr Unit 1E
- 21-45 44th Dr Unit 1K
- 21-45 44th Dr Unit 1M
- 21-45 44th Dr Unit 6-D
- 21-45 44th Dr Unit 1I
- 21-45 44th Dr Unit 3-D
- 21-45 44th Dr Unit 5-B
- 21-45 44th Dr Unit 3H