Estimated Value: $157,059 - $208,000
3
Beds
1
Bath
1,805
Sq Ft
$97/Sq Ft
Est. Value
About This Home
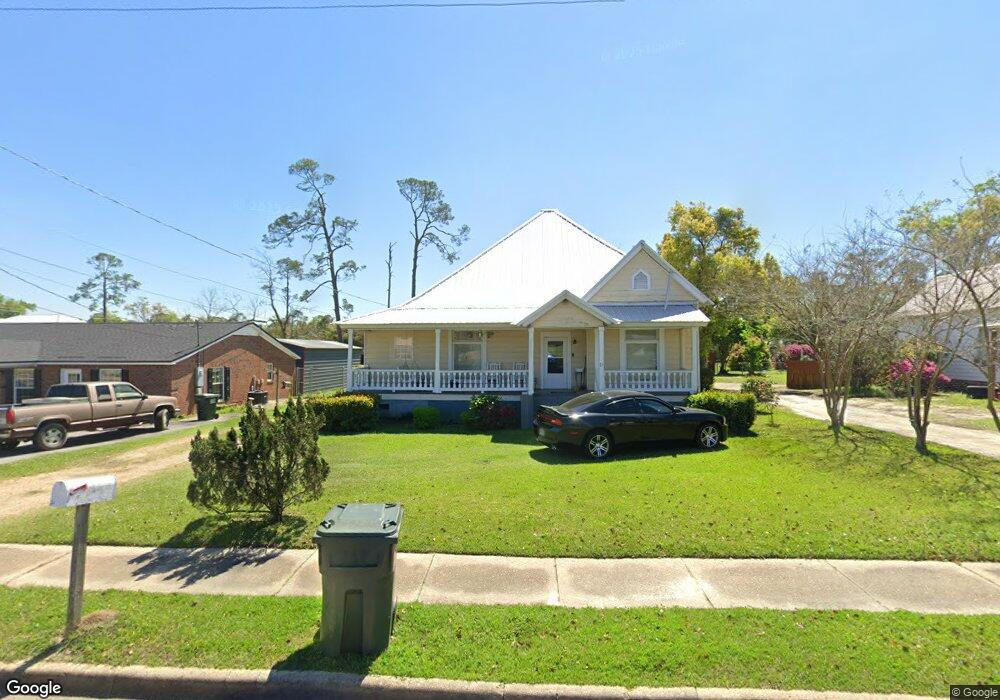
This home is located at 21 4th Ave SW, Cairo, GA 39828 and is currently estimated at $174,765, approximately $96 per square foot. 21 4th Ave SW is a home located in Grady County with nearby schools including Cairo High School.
Ownership History
Date
Name
Owned For
Owner Type
Purchase Details
Closed on
Jul 27, 2006
Sold by
Brown Monica
Bought by
Brown Monica and Brown Danuall
Current Estimated Value
Home Financials for this Owner
Home Financials are based on the most recent Mortgage that was taken out on this home.
Original Mortgage
$64,550
Outstanding Balance
$45,721
Interest Rate
10.38%
Mortgage Type
New Conventional
Estimated Equity
$129,044
Purchase Details
Closed on
Oct 31, 2002
Sold by
Secretary Of Veterans
Bought by
Coryell L Wayne
Purchase Details
Closed on
Dec 20, 2001
Sold by
Bennett Tracy
Bought by
Secretary Of Veterans
Purchase Details
Closed on
Aug 31, 2000
Sold by
Stephen Scott Randolph
Bought by
Bennett Tracy
Purchase Details
Closed on
Apr 9, 1999
Sold by
Hancock John L
Bought by
Stephen Scott Randolph
Purchase Details
Closed on
Dec 12, 1972
Bought by
Hancock John L and Hancock Susan B
Create a Home Valuation Report for This Property
The Home Valuation Report is an in-depth analysis detailing your home's value as well as a comparison with similar homes in the area
Home Values in the Area
Average Home Value in this Area
Purchase History
| Date | Buyer | Sale Price | Title Company |
|---|---|---|---|
| Brown Monica | -- | -- | |
| Brown Monica | $65,000 | -- | |
| Coryell L Wayne | -- | -- | |
| Secretary Of Veterans | -- | -- | |
| Bennett Tracy | $63,500 | -- | |
| Stephen Scott Randolph | $49,500 | -- | |
| Hancock John L | -- | -- |
Source: Public Records
Mortgage History
| Date | Status | Borrower | Loan Amount |
|---|---|---|---|
| Open | Brown Monica | $64,550 |
Source: Public Records
Tax History Compared to Growth
Tax History
| Year | Tax Paid | Tax Assessment Tax Assessment Total Assessment is a certain percentage of the fair market value that is determined by local assessors to be the total taxable value of land and additions on the property. | Land | Improvement |
|---|---|---|---|---|
| 2024 | $2,543 | $64,461 | $2,840 | $61,621 |
| 2023 | $1,206 | $32,582 | $2,313 | $30,269 |
| 2022 | $1,257 | $32,641 | $2,313 | $30,328 |
| 2021 | $1,260 | $32,641 | $2,313 | $30,328 |
| 2020 | $1,264 | $32,641 | $2,313 | $30,328 |
| 2019 | $1,263 | $32,641 | $2,313 | $30,328 |
| 2018 | $1,201 | $32,641 | $2,313 | $30,328 |
| 2017 | $1,155 | $32,641 | $2,313 | $30,328 |
| 2016 | $988 | $27,313 | $2,313 | $25,000 |
| 2015 | $978 | $27,313 | $2,313 | $25,000 |
| 2014 | $979 | $27,313 | $2,313 | $25,000 |
| 2013 | -- | $24,188 | $2,312 | $21,875 |
Source: Public Records
Map
Nearby Homes
- 000 S Broad St
- 40 5th Ave SW
- 000 Hwy 111 South 20 59 Acres
- 27 6th Ave SW
- 460 2nd St SW
- X 1st St
- 00 Hwy 111 South Tract 1
- 316,322 NW 1st St + Lot
- 0 1st St
- 309 3rd St SE
- 720 1st St SW
- 481 4th St SE
- 471 4th St SE
- 602 4th St SE
- 112 Pine Cir SW
- 117 Pine Cir SW
- 117 6th St SW
- 4761 Hadley Ferry Rd
- 530 6th Ave SE
- 270 Muggridge Ln